

Introduction
Data has become one of the most valuable assets for businesses in today’s digital world. Every online purchase, social media interaction, website visit, and financial transaction generates data that organizations use to make better decisions. However, raw data alone has little value unless it is analyzed effectively. This is where Python for Data Analytics plays a crucial role. Python has become the preferred programming language for data analysts because of its simplicity, flexibility, and extensive collection of libraries designed specifically for data analysis and visualization. Whether you want to analyze customer behavior, build business reports, automate repetitive tasks, or create predictive models, Python provides all the tools required to transform raw data into meaningful insights.
Unlike many programming languages that require extensive coding knowledge, Python is beginner-friendly and easy to learn. Its clean syntax allows students, working professionals, and career changers to start analyzing data without spending months learning complex programming concepts. Today, companies across industries such as healthcare, finance, retail, manufacturing, marketing, logistics, and e-commerce rely heavily on Python for making data-driven decisions.
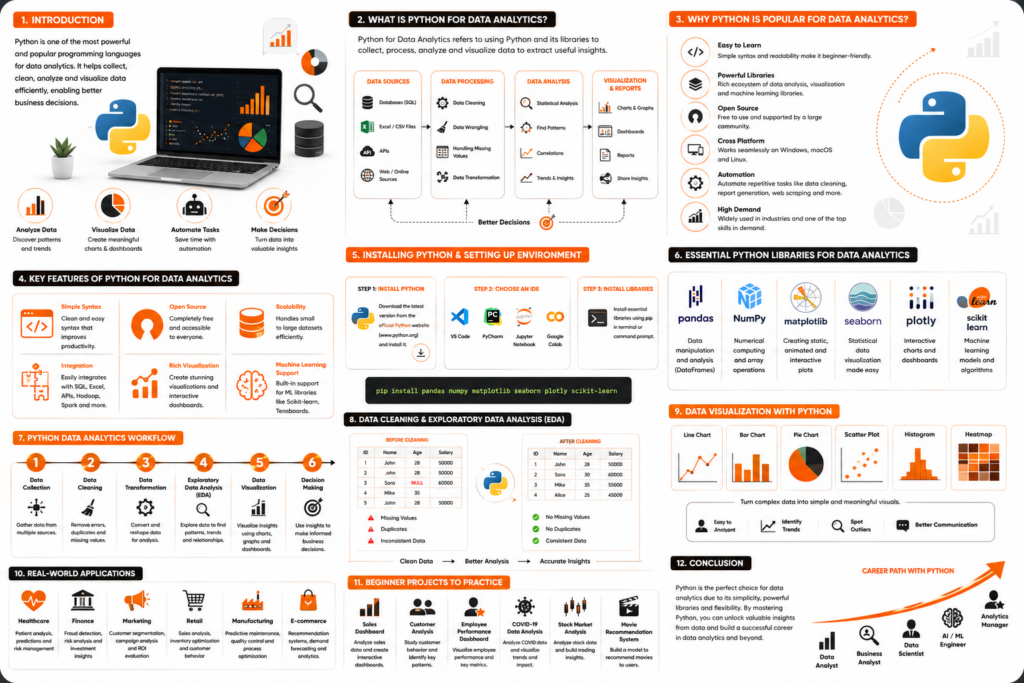
What Is Python for Data Analytics?
Python for Data Analytics refers to using the Python programming language to collect, process, analyze, and visualize data to uncover meaningful insights. It enables data professionals to gather information from multiple sources such as databases, spreadsheets, websites, APIs, and business applications. Python also simplifies data cleaning by removing errors, duplicates, and missing values, ensuring that datasets are accurate and reliable. Once the data is prepared, it helps organize large datasets into structured formats, making them easier to manage and analyze. In addition, Python provides powerful tools for performing statistical analysis to identify trends, patterns, and correlations within data. It allows users to create interactive dashboards and visual reports that present complex information in a clear and understandable way, helping organizations make informed decisions.
Why Python Is Popular for Data Analytics
Python continues to dominate the data analytics industry because it combines simplicity with powerful capabilities. Its easy-to-read syntax makes it one of the most beginner-friendly programming languages, allowing even users with little or no programming experience to learn it quickly. Python also offers a vast collection of open-source libraries that simplify tasks such as data analysis, visualization, statistical computing, machine learning, and automation. With a large global developer community, users have access to extensive documentation, tutorials, sample projects, and solutions to common challenges, making learning and problem-solving much easier.
Another major advantage of Python is its platform independence, as it runs seamlessly on Windows, macOS, and Linux without requiring significant code changes. It also excels at automating repetitive tasks such as data cleaning, report generation, web scraping, and dashboard updates, helping organizations save time and improve efficiency. Most importantly, Python remains one of the most in-demand programming languages across industries because it powers data analytics, artificial intelligence, business intelligence, and machine learning applications, making it an essential skill for aspiring data professionals.
Key Features of Python for Data Analytics
Simple Syntax: Python uses readable and concise code, reducing development time while improving productivity.
Open Source: Python is completely free, making it accessible to students, professionals, and organizations.
Scalability: Python efficiently processes both small datasets and millions of records without significant performance issues.
Integration: Python connects easily with SQL databases, Excel files, APIs, cloud services, Hadoop, Spark, and various visualization platforms.
Rich Visualization: Python enables users to build charts, graphs, dashboards, heatmaps, and interactive visualizations that simplify complex data.
Strong Machine Learning Support: Many machine learning frameworks, including Scikit-learn and TensorFlow, are built using Python, making it easier to transition from analytics to AI.
Installing Python and Setting Up Your Environment
Install Python
- Install Python by downloading the latest stable version from the official Python website and completing the installation process.
- During installation, make sure to enable the option to add Python to your system’s PATH so you can run it from the command line.
Choose an IDE
- Visual Studio Code
- PyCharm
- Jupyter Notebook
- Google Colab
Install Required Libraries
Pandas – A powerful library for data manipulation, cleaning, and analyzing structured datasets.
NumPy – Provides fast numerical computing and efficient handling of arrays and mathematical operations.
Matplotlib – A popular visualization library used to create charts, graphs, and plots for data analysis. Seaborn – Builds on Matplotlib to create attractive and informative statistical data visualizations with minimal code.
Plotly – An interactive visualization library for creating dynamic charts, dashboards, and business reports.
Scikit-learn – A machine learning library used to build predictive models, perform classification, regression, and data preprocessing.
Essential Python Libraries for Data Analytics
Python offers a rich ecosystem of libraries that simplify every stage of the data analytics process. Pandas is one of the most widely used libraries for working with structured data. It enables users to read Excel and CSV files, clean missing values, filter datasets, merge multiple files, sort and group data, and generate summary statistics with minimal code. These capabilities make Pandas an essential tool for data cleaning, transformation, and exploratory analysis.
NumPy provides the foundation for numerical computing in Python. It supports fast mathematical calculations, efficient multi-dimensional arrays, statistical operations, matrix manipulation, and linear algebra functions. Because of its speed and performance, many other data analytics and machine learning libraries are built on top of NumPy.
For data visualization, Matplotlib is a popular library that helps analysts create clear and informative charts, including line charts, bar charts, pie charts, scatter plots, and histograms. It allows users to present trends, patterns, and comparisons in a visually meaningful way. Seaborn, which is built on Matplotlib, offers advanced statistical visualization features such as heatmaps, correlation matrices, distribution plots, box plots, and violin plots. Its attractive default styles make complex data easier to interpret. Plotly is designed for creating highly interactive dashboards and business reports. Unlike static charts, Plotly allows users to zoom, filter, hover over data points, and interact with graphs, making it an excellent choice for executive presentations and real-time business analytics. Scikit-learn, while best known as a machine learning library, is also valuable for data analytics. It provides tools for data preprocessing, feature engineering, model evaluation, and predictive analytics, enabling analysts to build accurate models after completing exploratory data analysis.
Understanding the Data Analytics Workflow
Data Collection: Gather data from various sources such as Excel files, SQL databases, APIs, cloud storage, web scraping, or business applications.
Data Cleaning: Remove duplicate records, correct formatting issues, fill missing values, and eliminate inconsistencies to improve data quality.
Data Transformation: Convert raw data into meaningful formats suitable for analysis by changing data types, creating new columns, and restructuring datasets.
Exploratory Data Analysis: Analyze distributions, identify trends, detect outliers, and discover relationships between variables before building reports or predictive models.
Visualization: Present findings using charts, graphs, dashboards, and interactive reports that stakeholders can easily understand.
Decision Making: Interpret analytical results and recommend actionable business decisions based on data-driven insights.
Data Collection and Importing Data
- Excel spreadsheets
- CSV files
- SQL databases
- REST APIs
- JSON files
- Web scraping
- Cloud storage
- Business ERP systems
Data Cleaning and Preparation
Real-world datasets are rarely perfect. They often contain missing values, duplicate records, inconsistent formatting, spelling errors, and incorrect data types. Before meaningful analysis can begin, this raw information must be cleaned and prepared. Python simplifies data cleaning through powerful libraries like Pandas, allowing analysts to identify and fix issues efficiently. Common tasks include removing duplicate entries, filling or deleting missing values, converting date formats, renaming columns, correcting inconsistent text, and filtering irrelevant records. Analysts may also combine multiple datasets into a single table, create calculated fields, and standardize values to ensure consistency across reports.
A well-prepared dataset improves the accuracy of analysis, reduces errors, and helps businesses make reliable decisions. In professional environments, data cleaning often consumes a significant portion of an analyst’s time because the quality of insights depends heavily on the quality of the underlying data.
Exploratory Data Analysis (EDA)
Once the data has been cleaned, the next step is Exploratory Data Analysis (EDA). EDA is the process of examining a dataset to understand its structure, identify trends, detect anomalies, and uncover relationships between variables before performing advanced analysis or building predictive models. Python makes EDA simple with libraries like Pandas, NumPy, and Seaborn, allowing analysts to summarize and visualize data quickly. During this stage, analysts calculate descriptive statistics such as mean, median, mode, standard deviation, and percentiles to gain a better understanding of the dataset. They also examine correlations between variables, identify outliers, and analyze the distribution of data using visualizations.
- Checking the size and structure of datasets
- Identifying missing or duplicate values
- Calculating summary statistics
- Finding relationships between variables
- Detecting unusual data patterns
- Understanding category distributions
Data Visualization with Python
Data visualization transforms raw numbers into meaningful charts and graphs that are easy to understand. Instead of reading thousands of rows of data, decision-makers can identify trends, patterns, and business opportunities through visual representations.
Line Charts
Line charts display trends over time and are commonly used to analyze sales growth, website traffic, stock prices, and monthly business performance.
Bar Charts
Bar charts compare values across different categories, making them useful for comparing product sales, employee performance, or regional revenue.
Pie Charts
Pie charts illustrate percentage distributions and are often used to represent market share, customer segmentation, or budget allocation.
Scatter Plots
Scatter plots help analysts understand relationships between two variables, making it easier to identify positive or negative correlations.
Histograms
Histograms display how data is distributed, helping analysts identify skewness, frequency, and overall data patterns.
Heatmaps
Heatmaps use color intensity to represent relationships within data, especially correlation between variables. They are widely used in business analytics and research.
Box Plots
Box plots help identify data spread, median values, and outliers, making them useful for comparing distributions across multiple groups.
Interactive visualization tools like Plotly allow users to zoom, filter, and explore charts dynamically, making dashboards more engaging and informative.
Statistical Analysis Using Python
Statistical analysis helps businesses move beyond simple reporting by identifying patterns, relationships, and probabilities within data. Python includes numerous statistical tools that enable analysts to make evidence-based decisions.
Descriptive Statistics
- Mean
- Median
- Mode
- Standard Deviation
- Variance
- Minimum and Maximum Values
Correlation Analysis
- Advertising spend vs. sales
- Study hours vs. exam scores
- Website traffic vs. conversion rate
Hypothesis Testing
Organizations use hypothesis testing to determine whether observed differences are statistically significant or occurred by chance. This technique supports data-driven decision-making in areas such as marketing campaigns, product improvements, and customer behavior analysis.
Probability Analysis
Probability analysis estimates the likelihood of future events, helping businesses assess risks and make informed predictions. Python libraries such as SciPy and Stats models simplify complex statistical calculations, allowing analysts to focus on interpreting results rather than performing manual computations.
Real-World Applications of Python in Data Analytics
Business Intelligence: Companies use Python to generate automated reports, monitor key performance indicators (KPIs), and build interactive dashboards for informed decision-making.
Finance: Financial institutions analyze investment performance, detect fraudulent transactions, forecast market trends, and evaluate financial risks using Python.
Healthcare: Hospitals and healthcare providers use Python to analyze patient records, predict disease outbreaks, optimize treatment plans, and improve operational efficiency.
E-commerce: Online retailers study customer behavior, recommend products, optimize pricing strategies, and forecast demand using Python-powered analytics.
Marketing: Marketing teams leverage Python to measure campaign performance, analyze customer engagement, segment audiences, and improve return on investment (ROI)
Manufacturing: Manufacturers use predictive analytics to monitor equipment performance, reduce downtime, optimize inventory, and improve production quality.
Education: Educational institutions analyze student performance, monitor learning outcomes, and improve academic planning through data-driven insights.
Beginner Projects to Practice Python Data Analytics
Hands-on projects are one of the most effective ways to develop Python data analytics skills because they allow you to apply theoretical knowledge to real-world scenarios. Working on practical projects also helps build a strong portfolio that showcases your analytical abilities to potential employers. As you gain experience, you become more confident in collecting, cleaning, analyzing, and visualizing data using Python and its libraries. A great starting point is building a Sales Dashboard, where you analyze monthly sales data to visualize revenue, identify top-selling products, and track sales trends through interactive charts. Another useful project is Customer Analysis, which involves studying customer demographics, purchasing behavior, and buying patterns to identify target audiences and support better marketing decisions. You can also create an Employee Performance Dashboard to evaluate productivity, attendance, and key performance metrics using Python-generated reports and visualizations.
Another excellent practice project is COVID-19 Data Analysis, where you explore publicly available datasets to examine infection rates, recovery trends, vaccination progress, and regional comparisons. If you’re interested in finance, Stock Market Analysis helps you visualize stock price movements, compare company performance, and identify historical market trends using data visualization techniques. You can also work on Movie Recommendation Analysis, where you analyze movie ratings, genres, and user preferences to create a simple recommendation system. Completing these beginner-friendly projects strengthens problem-solving skills, improves your understanding of data analytics workflows, and provides valuable experience working with real-world datasets.
Conclusion
Python has become one of the most powerful and widely used programming languages for data analytics because of its simplicity, flexibility, and extensive ecosystem of libraries. From collecting and cleaning data to performing statistical analysis and creating insightful visualizations, Python enables analysts to transform raw information into meaningful business insights. Its ability to integrate with databases, cloud platforms, machine learning frameworks, and business intelligence tools makes it an essential skill for anyone pursuing a career in data analytics. If you’re looking to build a successful career in data analytics, enrolling in a structured training program can accelerate your learning. At Login360, our Data Analytics Course combines Python programming, SQL, Power BI, Excel, statistics, and hands-on projects with expert mentorship to prepare you for real-world industry challenges. Whether you’re a student, a working professional, or someone planning a career switch, gaining practical Python data analytics skills today can help you unlock exciting career opportunities in the future.



[…] Python is considered the most popular programming language in data science due to its simplicity, flexibility, and extensive ecosystem of libraries. It enables professionals to perform data cleaning, statistical analysis, machine learning, and artificial intelligence development using a single programming language. […]