

Table Of Contents
Introduction
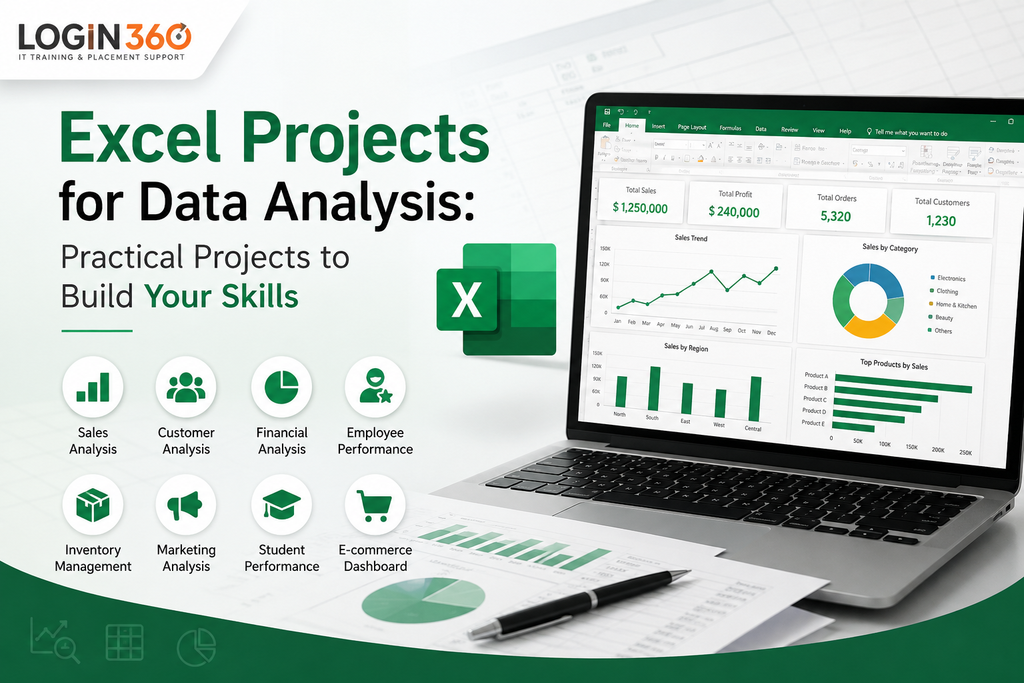
Excel Projects for data analysis are a good way to learn how to perform actual data analysis. Excel is among the most popular software for organising data, performing calculations, extracting insights and making data-driven decisions. Although the popularity of similar software such as SQL, Python, Power BI, and Tableau is growing, it remains important to know Excel for beginners and professionals in the field of data analysis. Having to complete Excel projects for data analysis, you will have an opportunity to work with real data and see how unprocessed information can be converted into meaningful insights. Another advantage that is worth mentioning is that you don’t have to be an experienced programmer to analyse data using Excel. Through various projects in Excel, you will improve your analytical skills and create projects for your portfolio. Also, these projects will help you gain practical skills needed for data analysis in the future.
Why Are Excel Projects for Data Analysis Important?
Data analysis goes beyond just inputting the figures in the Excel table. A competent data analyst should be familiar with data collection, cleaning, organisation, analysis, and visualisation. Working on Excel projects gives an opportunity to work with actual datasets that have duplicates, missing values, discrepancies, typos, and unwanted data. These projects teach how to analyse and clean the data and also include data collection, data analysis, PivotTables, visualisation, dashboards, and presentations.
1. Sales Data Analysis Project
Sales data analysis is among the projects that one can undertake when beginning to analyse data. Most businesses use sales data, thus making it quite applicable in real-world business situations. Elements in a basic dataset include Order ID, Product name, Category of product, Sales, Quantity, Region, Client’s name and Order date. The main aim of this project would be to get insight into the performance of the business and any trends. Excel functions such as SUM, SUMIFS, COUNTIF, and AVERAGE can be used to calculate the data, while a Pivot Table would allow summarisation of the data in seconds.
2. Customer Analysis Project
Customer data is critical to an organisation because it allows the organisation to know the behaviour of customers, their preferences, and their purchasing habits. Through analysis of the customer data, companies will be able to identify popular products as well as enhance their marketing efforts. The customer database can have elements like Customer ID, Customer Name, Age, Location, Product Purchased, Purchase Amount, and Purchase Date. The analysis of this data through Excel will enable us to know the following trends:
3. Financial Data Analysis Project
Excel is widely used for financial analysis because it simplifies calculations, budgeting, data organisation, and reports. Data Analysis Financial Projects assist the students in learning how businesses track their performance by analysing data like Date, Income, Expenses, Profit, Budget, and Expense Categories. With the analysis of the data, the students can calculate incomes and expenses, compare real expenses with budgets, determine profit periods, and analyse spending patterns. Charts in Excel, such as line charts, will help illustrate the changes in finances through time, and column charts will illustrate the comparison between categories or periods. PivotTables can be used in organising the financial data as well.
4. Employee Performance Analysis
There is a plethora of data related to the personnel that the human resources department is responsible for. The employee performance analysis project can illustrate the application of data analytics in the management of the personnel. Performance marketing is data-driven and aims at ensuring tangible results through running digital marketing campaigns. It allows for reaching target audiences, leads generation, conversions, and increased ROI. The project implies the analysis of the performance of the campaigns, the identification of metrics, success stories, and the optimization of campaigns based on the findings. Among the functions to be useful in the project are Average, Max, Min, CountIf and If. The development of the human resources dashboard, including the total number of the employees, performance of departments, attendance and salary, is possible as well.
5. Inventory Management Analysis
Inventory management is very crucial in businesses dealing with tangible products since they have to maintain adequate stocks without having excess inventory. The analysis of inventory data assists organisations in maintaining the level of stocks, identifying the items that should be reordered, managing the suppliers and reducing the cost of inventories. The possible variables in the inventory data set could be Product ID, Product Name, Category, Stocks on Hand, Re-order Point, Supplier and Unit Price. In the use of Excel, students will be able to identify products that have insufficient stocks, products that should be reordered, make comparisons of stocks in different categories and also analyse product prices.
6. Marketing Campaign Analysis Project
Marketing campaigns produce lots of information that is valuable to know. The digital marketer measures impressions, clicks, conversions, costs, and revenues to understand the performance of campaigns.The marketing database can consist of marketing campaign name, marketing channel used, budget, number of impressions, number of clicks, number of conversions, and profit. Excel can be used to calculate different marketing metrics like Click Through Rate (CTR), Conversion Rate, and ROI. CTR = Clicks ÷ Impressions × 100, while Conversion Rate = Conversions ÷ Clicks × 100, and ROI = Profit ÷ Investment × 100. The advantages of this project are that it can help organizations to know how to measure marketing success.
7. The Student Performance Analysis
8. E-Commerce Sales Dashboard
Creating an e-commerce sales dashboard can be a good project choice for a data analytics portfolio. An e-commerce dataset can contain Order ID, Customer Name, Product, Category, Quantity, Sales, Profit, Region, and Order Date. The key objective is the development of an interactive dashboard that will provide an overview of business performance. Potential KPIs can be Total Sales, Total Profit, Number of Orders, Number of Customers, as well as visual representations of the trend of monthly sales, sales per category and region, and best-selling product. PivotTables and slicers can make the dashboard interactive, letting the user filter data by year, region, or category.
Skills You Need for Data Analysis Projects in Excel
During work with Excel projects, you should develop several useful skills.
Data Cleaning
The cleaning process is very important when performing a data analysis project, as the quality of data impacts the results. There are a number of features provided by Excel, such as Remove Duplicates, Find and Replace, Text to Columns, TRIM, Sorting and Filtering, that are helpful in detecting and correcting inaccuracies in the data. All these features help to eliminate duplications, errors, separate the data, get rid of the extra space, and organise the data sets. Clean and correct data are important as inaccurate data may cause wrong conclusions and poor decisions. Thus, it is important to master the data cleaning process via Excel.
Excel Formulas and Functions
Key formulas used for data analysis are:
-
-
SUM
-
-
-
AVERAGE
-
-
-
COUNT
-
-
-
IF
-
-
-
SUMIF
-
-
-
COUNTIF
-
-
-
SUMIFS
-
-
-
COUNTIFS
-
It is also recommended to study lookup functions like XLOOKUP, VLOOKUP, INDEX, and MATCH. Such functions are useful when working with several tables and huge data sets.
PivotTables
PivotTables are some of the most useful Excel features for data analysts. This feature makes it possible to analyse large amounts of data easily. With PivotTables, you can calculate total sales by region, revenue by category, or average employee performance.
Data Visualization
Charts help visualise information and make it easier to understand.
Some useful types of charts are:
-
-
Bar charts
-
-
-
Column charts
-
-
-
Line charts
-
-
-
Pie charts
-
Building an Excel Portfolio
Project execution is important, but presentation plays an equally crucial role. For each of the projects, provide a title of the project, project goal, description of the dataset, and details about data cleaning. Completing different data analysis projects in Excel can help you build a strong portfolio and demonstrate your practical analytical skills to employers. It would be necessary to explain the use of formulas, Pivot Tables, and other approaches in the analysis. Provide screenshots of your dashboard and discuss the key findings from your analysis. A portfolio will help employers realise your technical knowledge, problem-solving, and analytical
Conclusion
A beginner can become a better analyst in his or her skills and knowledge by constantly engaging in data analysis exercises using Excel. Exercises that focus on sales analysis, customer analysis, financial analysis, employee analysis, inventory analysis, marketing analysis, students’ performance, and e-commerce dashboards will prove very useful. The most efficient way to accomplish this is through practising from small projects to large projects. Every project will increase your confidence and help you in the future when becoming a data analyst. These practical experiences will enable you to understand real data.
Get Started with Data Analytics by Login360
Are you looking for opportunities to learn and apply Excel and data analysis? Login360 provides industry-specific courses for learners to get hands-on experience with datasets and analytical tools. Get yourself trained in Excel, SQL, Power BI, and Python and develop the required skill set for a career in data analytics.
Get started on your data analytics career with Login360 and convert your learning into practical skills