
Table of Contents
Introduction
A subscription business might see cancellations rise and consider offering a discount to every customer. If most cancellations come from customers who never finish setting up their accounts, a shorter onboarding process or a timely support email may be a better first test. The two responses cost different amounts and reach different groups of customers. Data-driven business insights help teams choose where to spend their time and budget. They also give teams a common way to discuss the decision. In the subscription example, marketing and customer support can review the same cancellation and onboarding records, agree on the customer group to focus on, and measure how the proposed change affects retention. If the results suggest the change helped, the team can decide whether to roll it out more widely.
Separate Raw Data from Business Insights
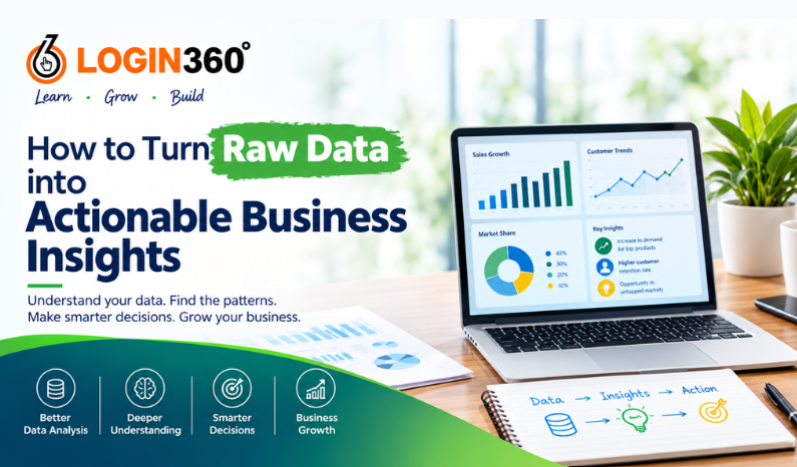
Raw data consists of the facts and figures you collect, such as individual sales transactions, website visits, product prices, and customer feedback. Organising these records into reports, charts, or tables helps you see what happened. Data-driven business insights emerge when you interpret those patterns in the context of a decision. For example, a sales report might show that one product generates more revenue than others. Look at whether it attracts repeat customers, receives better reviews, or sells particularly well in certain months. Each explanation suggests a different response. Seasonal demand might justify ordering more stock before a busy period, while frequent repeat purchases might support a campaign for existing customers. To see how data-driven business insights can guide inventory planning, compare sales with stock availability. A product may appear to sell poorly in one month because it was unavailable for part of that month. Knowing how many days it was in stock gives the purchasing team a better basis for its next order.
Start with a Clear Business Objective
Useful data-driven business insights start with a question tied to a business goal. Identify the problem you want to solve before deciding what data to collect. Your goal might be to increase sales, reduce operating costs, improve customer satisfaction, generate more leads, or reduce cancellations.
A clear objective helps you choose which metrics to measure and which tools to use. For example, if the aim is to improve customer retention, compare the percentage of customers who place a second order across different groups over the same period. That comparison can provide data-driven business insights about where to focus retention efforts. It also helps you collect a manageable set of figures and explain why each one matters.
Collect Data from Reliable Sources
- Sales and transaction records :Sales and transaction records provide valuable information about revenue, order volumes, product performance, purchasing patterns, and seasonal demand. Businesses can use these records to identify their best-selling products, understand customer buying behavior, and develop data-driven business insights that support better sales strategies and business growth.
- Customer relationship management (CRM) systems : CRM systems store important information about customer interactions, sales opportunities, preferences, and retention. By analyzing this information, businesses can understand customer needs, strengthen relationships, improve customer satisfaction, and generate data-driven business insights to support effective marketing and sales decisions.
- Website analytics : Website analytics helps businesses understand where visitors come from, which pages they engage with, and how frequently they complete desired actions. These metrics provide data-driven business insights that help companies optimize website performance, improve user experience, and increase conversion rates.
- Social media platforms: Social media platforms provide valuable engagement metrics such as likes, comments, shares, impressions, and reach. Analyzing these metrics helps businesses understand audience preferences, evaluate content performance, and develop data-driven business insights to improve social media marketing strategies.
- Customer feedback: Customer feedback collected through reviews, surveys, and support conversations helps businesses identify common complaints, expectations, and areas for improvement. By analyzing this feedback, organizations can gain data-driven business insights that support better product development, customer service, and customer satisfaction..
- Operational systems: Operational systems provide information about inventory records, delivery reports, production activities, and business processes. Analyzing this data helps organizations identify delays, reduce operational bottlenecks, improve resource utilization, and generate data-driven business insights for better operational efficiency.
Clean and Organise Your Data
Accurate records are the foundation of reliable data-driven business insights. Raw data may contain duplicate entries, missing values, incorrect figures, inconsistent dates, or spelling mistakes. If transactions appear twice in a spreadsheet, a monthly report could show higher revenue than the business actually earned. Start by removing duplicates where appropriate, correcting inconsistent formats, identifying missing information, and checking for unusual values. Make sure dates, currencies, and product names follow consistent formats. Tools such as Microsoft Excel, Google Sheets, SQL, and Python can make this process easier.Two entries with the same product and price could represent separate purchases. Compare order IDs, payment references, and timestamps before removing either one.
The criteria for identifying a duplicate should reflect what each row represents, whether it is an order, an item within an order, or a customer record. Investigate unusual values and missing entries before making changes. An unusually high sale may be genuine, and a blank field may need to be checked against the original record. Keep a short record of how you handled duplicates and missing values so colleagues can trace data-driven business insights back to the figures that support them. If you update the report next month, that record also helps you apply the same cleaning rules.
Explore Patterns, Trends, and Relationships
Once the data is clean, compare it across months, products, locations, and customer groups to look for data-driven business insights. Start with totals, averages, percentages, and growth rates. An online retailer might analyse which products generate the most orders, while a marketing team could compare campaigns to see which ones generate the most qualified leads.
Data visualisation makes patterns easier to recognise. A line chart helps show how revenue changed over time, while a bar chart makes it easier to compare product categories. Microsoft Power BI, Tableau, Looker Studio, and Excel can help you build charts and dashboards that show the detail your team needs. Use rates when comparing groups of different sizes. One branch may receive more complaints than another because it handles more orders. Compare complaints per 100 orders across branches for the same period. Show the number of orders alongside each rate so readers can see when a result comes from a small group. Imagine that a company’s revenue falls by 15% over three months. A breakdown might reveal that the decline is concentrated in one product category. To develop data-driven business insights from that pattern, check what changed in pricing, stock availability, and demand for those products. Comparing the same period last year can also help you see whether a seasonal drop is typical.
Identify the Root Cause of Business Problems
- Comparative analysis :compares results across different periods or groups.
- Drill-down analysis :breaks down overall performance by product, region, or customer segment.
- Customer segmentation: groups customers by relevant behaviour or purchasing patterns.
- Root cause analysis :investigates the factors contributing to a problem.
- Correlation analysis :explores whether two variables tend to change together.
Put Data-Driven Business Insights to Work
Choose a response you can test and measure. If an online store discovers that shoppers often abandon their carts after seeing delivery charges, it could test showing shipping costs earlier, offering free delivery above a minimum order value, or introducing a lower-cost delivery option. A retailer that frequently runs out of popular products could adjust its reorder levels based on past sales and delivery lead times.Use four questions to turn data-driven business insights into a plan.
- What did the analysis reveal?
- What action should the business take?
- Who is responsible for implementing the change?
- How will the team measure success?
Measure Results Using Key Performance Indicators
| Business area | Example KPIs |
|---|---|
| Sales | Revenue, conversion rate, average order value, and repeat purchase rate |
| Marketing | Customer acquisition cost, cost per lead, campaign conversion rate, and return on advertising spend |
| Operations | Inventory turnover, order fulfilment time, delivery accuracy, and operating costs |
| Customer experience | Customer satisfaction, retention rate, complaint resolution time, and customer churn |
Use AI and Data Analytics Tools Effectively
Different tools support different stages of finding data-driven business insights. Excel and Google Sheets are useful for basic analysis, while SQL helps retrieve records from databases. Python supports data processing, statistical analysis, and predictive modelling. Business intelligence platforms such as Power BI and Tableau help teams build interactive dashboards.
AI tools can help summarise reports, identify unusual patterns, analyse customer feedback, forecast demand, and suggest questions worth investigating. A retailer could use historical sales data to estimate future demand and plan inventory. A support team could group feedback comments to identify recurring complaints.Check AI-generated findings against source records before relying on them as data-driven business insights. If a tool reports that customers frequently complain about delivery, review a sample of the comments to see whether the issue is late arrival, damaged packaging, or poor tracking. Ask someone who knows the business process to review the findings, and protect confidential information when choosing what to analyse.
Build a Data-Driven Business Culture
Data-driven business insights have more impact when teams use them in everyday decisions. Make relevant reports accessible, provide basic data literacy training, and agree on how teams will define and track performance indicators. Managers can help by explaining the evidence behind decisions and giving colleagues room to raise questions about the data. A campaign that performed well last year may deliver different results today because customer preferences or market conditions have changed. Regular reviews give teams a chance to discuss new data-driven business insights and decide who will follow up. A monthly review, for instance, can cover which metrics changed, what the team thinks caused the change, and which question it wants to investigate next. Record the decision alongside the evidence used to make it. At the next review, the team can check what happened and decide whether the approach needs adjustment.
Conclusion
Turning raw data into data-driven business insights starts with a clear question and ends with a decision you can evaluate. Collect reliable information, clean it, look for patterns, and investigate what might be driving them. Even a simple spreadsheet of sales records or customer feedback can reveal where to focus if it answers a specific business question. Start with one decision your team needs to make this month. Choose a measure, review the available records, and agree on a change to test. The result gives you evidence for the next decision and a record of what your team has learned.
Want to practise developing data-driven business insights from raw data? Visit Login 360 to explore data analytics training and build skills you can use in your next project.