
Introduction
Have you ever wondered how businesses know what their customers like, or how they can predict how much they will sell? Often this is due to data analytics. Using AI makes it easier for businesses to understand their information and make more informed decisions.
All businesses have some data coming from their website, mobile apps, customer interaction and online shopping. However, it is important to understand what this data means and how it can help improve the performance of the business.
Using Data Analytics with AI can help professionals understand patterns, customer behaviour and new opportunities in a business. If you’re a student, fresh graduate or working professional in Chennai you can open up some amazing career opportunities. You don’t need any programming knowledge to get started. Anyone can get started with the correct method.
What is Data Analytics?
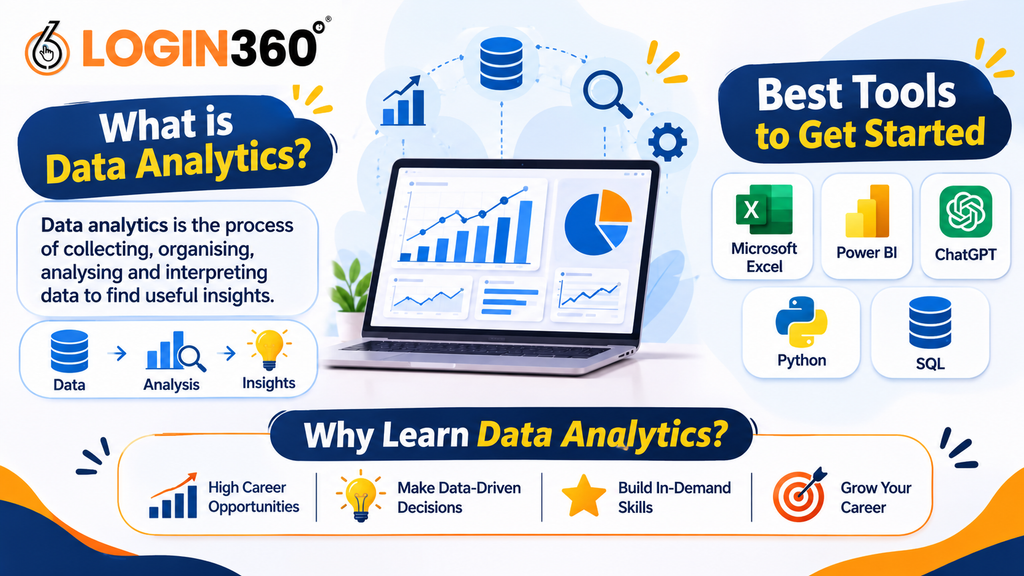
Data analytics is the collection, organisation, analysis and interpretation of data to find useful information. This helps businesses to make decisions based on facts.
Say, a retail store has noticed a drop in sales each month. They can use data analytics to understand what their customers are buying, what the prices are, seasonal trends and promotions.
They may notice that less products are being bought due to higher prices or the competition offering better discounts.
This will help them to make more informed decisions.
There are four main types of data analytics.
Descriptive Analytics – What happened?
This helps a business understand past performance. For example, looking at sales reports each month to see how much revenue was made.
Diagnostic Analytics – Why did it happen?
This helps identify why something happened. For example a business could look into why there was less traffic on their website or less sales in a particular month.
Predictive Analytics – What could happen?
This uses historical data and statistics to predict what will happen. For example, a business can predict what sales they will get next month based on previous sales.
Prescriptive Analytics – What should we do?
This helps a business understand what they could do. For example, suggest increasing advertising during a particular season to boost sales.
Overall, this helps organisations understand their performance and what to do next.
How Can AI Help with Data Analytics?
Traditional data analytics can involve a lot of manual work to clean up data, create reports and find patterns. This can be very time consuming, especially if there is lots of data.
AI can help analysts by doing some of the repetitive tasks and simplifying complex data.
For example, if a company receives thousands of customer reviews each month it can be hard to read through them all. Using AI tools can help group similar comments together, spot common issues and summarise what customers are saying.
AI can also help clean data by identifying missing values, outliers and inconsistencies. However, the analyst needs to check the recommendations.
AI can be used to help detect anomalies. Say a business has had a sudden spike in website traffic but less purchases. AI can help identify any anomalies.
AI can help with forecasting, creating reports, data visualisation and coming up with ideas.
However, the results will depend on the quality of the data, the questions being asked and the analyst’s ability to understand the results.
A good analyst will know how to use AI as a tool to help them make informed decisions.
Best AI Tools to Get Started with Data Analytics
As a beginner you don’t need to learn all the tools. Start with a few popular ones.
Microsoft Excel
One of the most useful tools to start with. This will allow you to organise your data, do calculations, create reports and spot trends.
Some useful features include;
SUM, AVERAGE, IF and COUNTIF formulae
Sorting and Filtering
PivotTables
Charts and Graphs
Data Cleaning
AI features can help you understand the formulae and explore your data.
For example, you could use Excel to analyse sales each month and see which products are bringing in the most revenue.
Power BI
A business intelligence tool. This will take raw data and turn it into interactive dashboards and reports.
This will help businesses keep track of key metrics such as revenue, customer growth, costs and sales.
Analysts can join different data sets together, create visual reports and share insights with the business.
AI features can help you explore your data.
ChatGPT
ChatGPT can be useful when trying to understand technical concepts or new data sets.
As a beginner you could use this to;
Understand SQL queries and Python
Learn Excel formulae
Explore analytical methods
Come up with ideas for data projects
Explain technical concepts in layman’s terms
For example, you could ask ChatGPT to explain how a PivotTable works using a small data set of sales.
Always check the AI responses. Especially if the data involves calculations, reports or sensitive information.
Python
A popular programming language. Used for data analytics, automation and machine learning.
Using libraries like Pandas and NumPy will help you clean, organise and analyse your data. You can also use Matplotlib to create charts.
This is especially useful when working with large data sets and repetitive tasks.
SQL
Structured Query Language. This is used to extract and manage data from a database.
Analysts often use this to filter data, join tables, calculate totals and prepare data.
Learning SQL is an important step if you want to build a career in data analytics.
Overall, these tools will give you a good understanding of how businesses work with data today.
How to Get Started with Data Analytics using AI (As a Beginner)
Getting started with a new technical skill can be daunting, especially if you have no programming experience. The best way to start is to learn each concept one at a time and practice.
Understanding how to learn Data Analytics using AI can help you create a clear learning pathway.
Step 1 – Understand the Basics of Data
Learn what data is and how businesses use it.
Learn some basic concepts such as data sets, tables, rows, columns, data types, averages, percentages and basic statistics.
Practice using a simple data set with product names, prices, quantities and sales.
Step 2 – Learn Excel
A good place to start. This will allow you to work with data without having to write complex code.
Practice using SUM, AVERAGE, IF and COUNTIF formulae. Learn how to sort your data, filter, remove duplicates and create pivot tables.
Once you understand the basics try creating a simple sales report for each month.
Step 3 – Understand SQL
Once you have learnt Excel, start to explore SQL.
Learn some basic commands such as SELECT, WHERE, ORDER BY, GROUP BY and JOIN.
This will help you extract data from a database and organise in the way you want.
For example, you could write a query to see what the best selling products are.
Step 4 – Learn Python
Once you are comfortable with the basics start to learn Python.
Learn about variables, lists, loops, functions and basic data structures. Once you understand the basics start to learn about Pandas and NumPy for data analysis.
Use AI tools to help you understand any unfamiliar code. However, it is important to practice the code.
Step 5 – Create Projects
Creating projects will help you understand how the analytical concepts work.
Try creating projects such as;
Sales performance
Customer purchasing behaviour
Website traffic
Employee performance reporting
Customer feedback using AI
Having a completed project will show you have practical knowledge which can be useful in interviews.
Step 6 – Use AI as a Learning Tool
AI tools can help explain difficult concepts, suggest ways to improve your code and help you explore different ways to analyse your data.
Don’t rely solely on the AI.
Try to solve problems on your own first. This will help improve your analytical and problem solving skills.
Data Analytics Roles for Freshers in Chennai
Chennai is a key technology and business hub. There are lots of opportunities in IT services, banking, healthcare, manufacturing, retail and e-commerce.
These industries produce lots of data and will need people who can organise, create reports and find useful insights.
Learning analytical tools can help freshers explore different career opportunities.
Common entry level roles include;
Role Responsibilities
- Junior Data Analyst Clean data and find patterns
- Data Analyst Analyse data sets and create reports
- Business Analyst Understand business needs and analyse data
- Reporting Analyst Create reports
- Business Intelligence Analyst Create dashboards and analyse business metrics
Students looking for data analytics jobs for freshers in Chennai can improve their career opportunities by learning Excel, SQL, Python and Power BI.
Practicing creating projects is especially important for freshers as they may not have any professional experience.
For example, they could create a dashboard in Power BI using a sales data set and explain how this report helps the business understand their performance.
This shows they have practical knowledge.
Communication and problem solving skills are also useful. Analysts need to be able to clearly explain their findings so the business can understand.
Why Data Analytics with AI is a Useful Skill
Businesses are increasingly looking to understand their data more efficiently. AI can help simplify some of the analytical processes. Data analytics will give you the foundations to understand the results.
Learning Data Analytics with AI will help freshers understand how technology can help businesses make decisions.
For example, a marketing team may use analytics to understand which advertising campaigns are bringing in the most leads. AI can help summarise how well the campaigns are performing and find patterns. The analyst will check the data and suggest improvements.
This can be useful in lots of industries.
Students searching for ai and data science in Chennai may also find it useful to understand how data analytics can be used practically.
Having a good foundation in Excel, SQL, Python and Power BI can help you progress onto learning more about artificial intelligence, machine learning and business intelligence.
Most importantly focus on understanding the concepts.
Conclusion
Data analytics with AI are helping businesses to collect, understand and use their data. This can help organisations understand customer preferences and predict sales trends to make more informed decisions.As a beginner you don’t need to get too complicated. Start with the basics of data, practice using Excel, understand SQL and then slowly move onto Python and Power BI. Once you are confident with these tools start to use AI to help with your analysis and improve your learning.
Practicing creating projects, regularly practicing and having an eagerness to learn will help you build a good foundation.