
Introduction
Have you ever wondered how companies know which products customers prefer, which advertisements generate more enquiries or why sales increase during certain months? The answer often comes from data analytics.Today, businesses collect information from websites, mobile applications, online purchases, customer enquiries and marketing activities. This information helps companies understand their customers and improve their performance. However, raw data alone cannot provide answers. It needs to be organised, analysed and understood properly. This is where data analytics plays an important role. It helps businesses turn everyday information into meaningful insights that support better decisions.
A Data Analytics Course introduces students and working professionals to the tools and techniques used to analytics information. From learning Excel and SQL to working with Python and Power BI, learners can develop practical skills that are useful across different industries. If you are searching for a Data Analytics Course in Chennai, this guide will help you understand the skills you can learn, the tools used in the industry, career opportunities and what to consider before choosing a training institute. Whether you are a fresher looking for a career opportunity or a working professional planning to improve your technical knowledge, data analytics can be an interesting field to explore.
What Is Data Analytics?
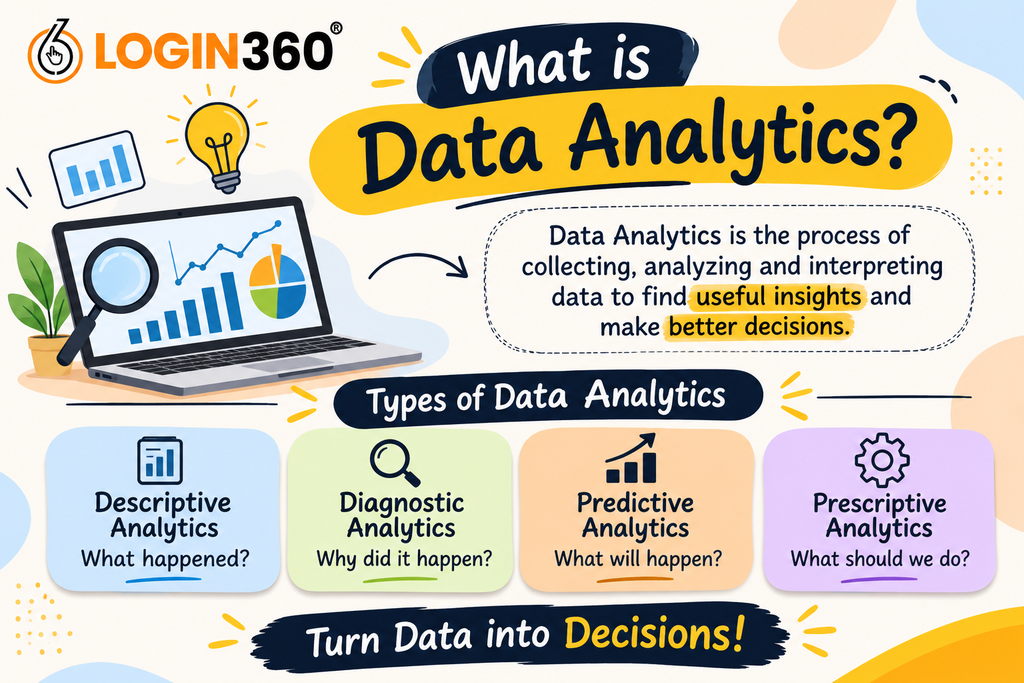
Data analytics is the process of collecting, organising, cleaning and analysing information to discover useful patterns and trends. In simple words, it means understanding what data is telling us and using that information to make better decisions. For example, imagine an online shopping company wants to increase its sales. The company can analyse previous orders to understand which products customers purchase most often, which months generate higher sales and which locations bring more customers. Similarly, a digital marketing team can analyse advertising results to understand how many people clicked an advertisement, how much money was spent and how many leads were generated. These insights help businesses identify what is working and where improvements are needed.
Data analytics is commonly used in:
- Banking and financial services.
- Healthcare and hospitals.
- Education and training.
- Retail and e-commerce.
- Information technology.
- Manufacturing.
- Digital marketing.
- Telecommunications.
Almost every industry can benefit from understanding its data.
Why Is Data Analytics Becoming Important?
Businesses today cannot depend only on assumptions when making important decisions. They need information that helps them understand their performance and plan their next steps. This is one of the main reasons why data analytics has become an important skill.
1. Better Business Decisions Companies can use data to understand customer behaviour, identify problems and make decisions based on actual performance.
2. Opportunities Across Industries Data analytics is useful in different sectors, including IT, banking, healthcare, retail and marketing. This gives learners different areas to explore.
3. Development of Technical Skills Learning analytics introduces you to tools such as Excel, SQL, Python and Power BI, which are commonly used in business environments.
4. Improved Problem-Solving Skills Analysing information teaches you how to identify a problem, examine the available data and find possible solutions.
5. Continuous Learning Opportunities
Technology keeps developing, and businesses regularly introduce new ways to manage and understand information. Professionals can continue improving their knowledge throughout their careers.
What Will You Learn in a Data Analytics Course?
A good Data Analytics Course in Chennai should help beginners understand the fundamentals before moving towards practical tools and techniques.
Here are some important skills you may learn during your training.
1. Microsoft Excel
Excel is one of the most commonly used tools in business environments. It helps professionals organise information, perform calculations and prepare reports. For beginners, Excel is often a good place to start because its spreadsheet format is easy to understand.
For beginners, Excel is often a good place to start because its spreadsheet format is easy to understand. During training, you may learn:
● Basic and advanced Excel formulas.
● Sorting and filtering.
● Data formatting.
●VLOOKUP and XLOOKUP.
● Pivot Tables and Pivot Charts.
● Conditional formatting.
● Data cleaning.
● Report preparation.
For example, a company can use Excel to compare monthly sales, calculate revenue and identify its best-performing products.
Learning Excel gives you a useful foundation before moving towards more advanced analytical tools.
2. SQL
SQL stands for Structured Query Language. It is used to communicate with databases and retrieve the information required for analysis.
Many companies store their customer, sales and transaction records in databases. SQL helps analysts access the required information without manually checking every record.
Some important SQL topics include:
● SQL fundamentals.
● SELECT and WHERE commands.
● ORDER BY.
● GROUP BY and HAVING.
● Joins.
● Subqueries.
● Aggregate functions.
● Database operations.
For example, an analyst can use SQL to find the total sales generated during a particular month or identify customers who purchased specific products.
Practising SQL helps you become more comfortable working with structured business information.
3. Python for Data Analytics
Python is a popular programming language used for data analysis, automation and visualisation. Although beginners may initially find programming unfamiliar, learning Python step by step can make the process easier.
A data analytics training programme may cover:
● Python basics.
● Variables and data types.
● Conditional statements.
● Loops and functions.
● NumPy.
● Pandas.
● Data manipulation.
● Basic data visualisation.
Python is useful when working with larger datasets and performing repetitive analytical tasks.
For example, instead of manually calculating information from thousands of records, Python can help automate the process.
4. Power BI
Power BI is a business intelligence tool used to convert raw data into interactive reports and dashboards.
Businesses often need to understand large amounts of information quickly. Power BI helps present important figures through visual reports.
You may learn:
● Connecting different data sources.
● Power Query.
● Data transformation.
● Data modelling.
● Dashboard creation.
● DAX fundamentals.
● Interactive visualisations.
For example, a sales dashboard can display monthly revenue, product performance and regional sales in one place.
This makes it easier for managers to understand business performance without going through multiple spreadsheets.
5. Data Cleaning and Visualisation
Before analysing information, it is important to check whether the data is accurate and properly organised. Sometimes datasets contain duplicate records, missing information, spelling mistakes or incorrect formats. Data cleaning helps identify and correct these issues. Data visualisation is the process of presenting information through charts, graphs and dashboards. A good visualisation makes complicated information easier to understand and helps people identify important patterns.
Who Can Join a Data Analytics Course?
One common question among beginners is whether they need an IT background to learn data analytics. The good news is that people from different educational backgrounds can explore this field.
Fresh Graduates: Students who have completed B.Com, BBA, B.Sc, BCA, B.E or other degree programmes can consider learning data analytics.
Working Professionals: Employees who want to improve their technical knowledge or explore a different career path can benefit from analytics training.
IT Professionals: Software developers, testers and other technical professionals can expand their skills by learning data analysis tools.
Non-IT Professionals: People working in finance, sales, marketing, HR and administration can use analytics to understand information related to their jobs.
Career Changers: Individuals interested in entering the technology industry can begin with the fundamentals and gradually develop their skills.
You do not need advanced programming knowledge to get started. Basic computer skills, logical thinking and an interest in learning are helpful.
Why Is Practical Training Important?
Learning definitions and watching demonstrations can help you understand a tool, but practical experience is what makes the learning process meaningful. When you work with actual datasets, you begin to understand how businesses use data to solve everyday problems.
For example, consider a sales analysis project. You receive a spreadsheet containing customer orders, product names, prices and purchase dates.
You can use Excel to clean the information, SQL to retrieve specific records and Power BI to create a dashboard showing monthly sales performance.
Other useful projects include:
Customer Behaviour Analysis: Understand customer preferences and purchasing patterns.
Sales Analysis: Identify popular products and compare monthly revenue.
Marketing Campaign Analysis: Study impressions, clicks, conversions and advertising costs.
Financial Analysis: Examine expenses, revenue and business performance.
Power BI Dashboard: Present important business information through interactive reports.
Working on projects also helps you explain your knowledge during job interviews. Keeping your completed projects in a portfolio can give employers a better understanding of your practical abilities.
Career Opportunities After Completing a Data Analytics Course
After learning the necessary concepts and tools, you can explore different career opportunities depending on your knowledge and experience.
Some common job roles include:
Data Analyst: Collects, cleans and analyses information to identify trends and support business decisions.
Junior Data Analyst: Helps senior team members with data preparation, reporting and basic analysis.
Business Analyst: Understands business requirements, identifies problems and recommends improvements.
Reporting Analyst: Prepares regular reports and tracks important business performance indicators.
Power BI Developer: Creates dashboards, reports and visualisations to present business information.
Business Intelligence Analyst: Uses data and reporting tools to identify trends and support business planning. The responsibilities and requirements for these roles can vary between companies. Building practical knowledge and developing communication skills can help you prepare for suitable opportunities.
How to Choose the Best Data Analytics Course in Chennai?
Chennai has a growing business and technology environment, with organisations operating in IT, banking, healthcare, manufacturing, retail and other sectors.
If you are searching for the Best Data Analytics Course in Chennai, take time to compare different training institutes before making a decision. Choosing the right Data Analytics Institute in Chennai can help you find a learning programme that matches your requirements and career goals.
Here are some things worth checking:
Course Syllabus: Make sure the programme covers important tools such as Excel, SQL, Python and Power BI.
Practical Projects: Check whether students get opportunities to work with datasets and complete assignments.
Trainer Experience: Experienced trainers can explain technical concepts and share useful practical knowledge.
Learning Support: Ask whether the institute provides doubt-clearing sessions and additional learning materials.
Interview Preparation: Resume guidance and mock interviews can help learners prepare for job applications.
Course Fees and Duration:
Compare the fees, course duration and modules included before enrolling.
You can also compare different options for Data Analytics Training in Chennai by checking course content, teaching methods, practical sessions and student feedback. Most importantly, choose a programme that gives you enough time to practise instead of focusing only on theoretical lessons.
What Is the Future Scope of Data Analytics?
The future of data analytics is closely connected to the way businesses use technology.
Companies are increasingly using digital systems to manage customer information, monitor performance and improve their operations.
Artificial Intelligence, Machine Learning, Cloud Computing and Business Intelligence are also influencing how organisations collect and analyse information.
These technologies are creating new ways to work with data. However, understanding the fundamentals remains important. Professionals still need to check data quality, ask the right questions, interpret results and communicate their findings.
Learning Excel, SQL, Python and Power BI can provide a foundation for exploring more advanced areas of analytics in the future.
Start Your Data Analytics Learning Journey with Login360
Choosing the right training programme is an important part of developing your skills.
At Login360, learners can explore data analytics training opportunities and understand the tools and concepts involved in this field.
If you are looking for a Data Analytics Course in Chennai, take time to review the course syllabus, training structure, practical assignments and learning support before making your decision. Make sure the programme matches your current skill level and future career goals.
Start with the basics, practise regularly and work on projects that help you understand how data is used in real business situations.
Conclusion
Data analytics is not simply about working with numbers. It is about understanding information, finding meaningful patterns and helping businesses make better decisions.
Learning Excel, SQL, Python, Power BI, data cleaning and visualisation can help you develop a strong foundation in this field.
Whether you are a fresher, a working professional or someone planning a career change, taking the time to learn and practise these skills can support your professional development.
If you are planning to build your skills, explore the Data Analytics Course in Chennai at Login360 and take your first step towards learning the tools and techniques needed to work with data.