
Table of Contents
Learning data science is not only about studying Python, statistics, machine learning, or SQL. To become job-ready, you also need to know how to use these skills to solve real problems.
This is where practical projects become important.
A good data science project shows recruiters that you can work with data, find useful patterns, build models, and explain your results clearly. It also gives you something meaningful to discuss during interviews.
If you are a beginner, you may have already worked with simple datasets such as the Iris or Titanic dataset. These are useful for learning the basics, but real-world projects can help you go one step further.
In this guide, we will explore real-world projects every data science beginner should try, the skills you can learn from each project, the tools you can use, and how to present your projects professionally.
Why Should Data Science Beginners Build Projects?
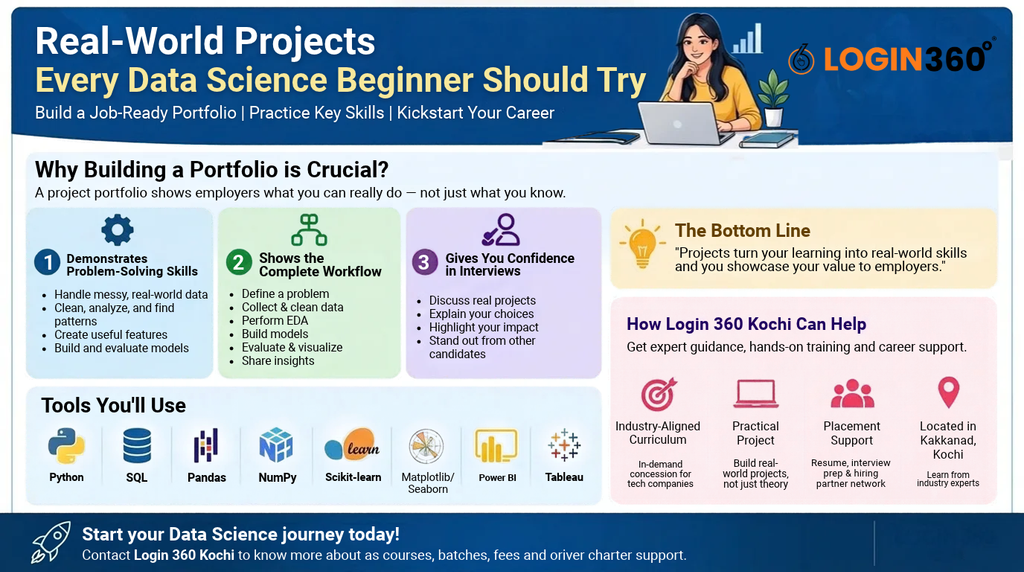
A strong project portfolio can work like a practical extension of your resume.
Instead of simply writing:
- Python
- SQL
- Machine Learning
- Power BI
- Pandas
on your resume, you can show recruiters how you actually used these skills.
1. Projects Show Practical Problem-Solving Skills
Real-world data is rarely perfect.
You may find:
- Missing values
- Duplicate records
- Incorrect data
- Outliers
- Different data formats
- Unnecessary columns
- Inconsistent information
Working on projects teaches you how to handle these situations.
You learn how to:
- Clean data
- Analyze information
- Identify patterns
- Create useful features
- Build models
- Test your results
- Communicate your findings
These practical skills are important when moving from classroom learning to professional work.
2. Projects Help You Understand the Complete Data Science Process
A good project allows you to practice the complete workflow:
Problem → Data Collection → Data Cleaning → EDA → Feature Engineering → Model Building → Evaluation → Visualization → Business Insights
This gives you a better understanding of how data science works as a complete process.
Imagine an interviewer asks:
“Tell me about a machine learning project you worked on.”
3. Projects Give You Something to Discuss in Interviews
If you have completed a practical project, you can explain:
- What problem you wanted to solve
- Where you got the data
- How you cleaned the data
- Which model you selected
- Why you selected it
- How you evaluated the model
- What you learned from the project
This makes your interview discussion more practical and specific.
10 Real-World Projects Every Data Science Beginner Should Try
Here are project ideas that can help beginners build different skills across data analysis, machine learning, NLP, visualization, and business intelligence.
1. House Price Prediction
Project Type: Regression
House price prediction is a useful beginner machine learning project because the objective is easy to understand.
Project idea
Build a machine learning model that predicts the approximate price of a house using information such as:
- Location
- Number of bedrooms
- Property size
- Number of floors
- Year built
- Property condition
- Parking availability
Skills you can practice
You can learn:
- Data cleaning
- Exploratory Data Analysis
- Feature engineering
- Regression
- Model evaluation
- Data visualization
Useful metrics
You can evaluate your model using:
- Mean Absolute Error (MAE)
- Mean Squared Error (MSE)
- Root Mean Squared Error (RMSE)
- R² score
Tools
Python + Pandas + NumPy + Scikit-learn + Matplotlib/Seaborn
2. Customer Churn Prediction
Project Type: Classification
Customer churn means a customer stops using a company’s product or service.
This is a common business problem for industries such as:
- Telecom
- Banking
- SaaS
- Streaming
- Insurance
Project idea
Build a model that predicts whether a customer is likely to leave a company.
You can use information such as:
- Customer tenure
- Monthly charges
- Subscription type
- Payment method
- Service usage
- Customer support interactions
Skills you can practice
You can learn:
- Classification
- Feature selection
- Handling missing data
- Class imbalance
- Model evaluation
- Business interpretation
Instead of looking only at accuracy, you can also study:
- Precision
- Recall
- F1-score
- Confusion Matrix
- ROC-AUC
Tools
Python + Pandas + Scikit-learn + Seaborn
You can experiment with models such as:
- Logistic Regression
- Random Forest
- XGBoost
3. Customer Segmentation
Project Type: Unsupervised Learning
Customer segmentation is especially useful for marketing and business analytics.
Companies usually have customers with different:
- Buying habits
- Spending levels
- Engagement
- Frequency of purchases
Treating every customer in exactly the same way may not always be useful.
Project idea
Group customers into different segments based on their purchasing behavior.
For example:
- High-value customers
- Frequent customers
- Occasional customers
- Low-engagement customers
What can you learn?
You can practice:
- RFM analysis
- Data preprocessing
- K-Means clustering
- Hierarchical clustering
- Elbow Method
- Silhouette Score
- Data visualization
Tools
Python + Pandas + Scikit-learn + Power BI/Tableau
You can also create a dashboard showing the characteristics of each customer segment.
4. Fake News Detection
Project Type: Natural Language Processing (NLP)
A large amount of information is available online in the form of articles, posts, reviews, and messages.
NLP helps computers work with human language.
Project idea
Create a text classification model that identifies whether a news article belongs to a particular predefined category, such as real or fake, using a suitable labeled dataset.
What will you learn?
You can practice:
- Text cleaning
- Tokenization
- Stop-word removal
- Stemming
- Lemmatization
- TF-IDF
- Text classification
You can experiment with algorithms such as:
- Naive Bayes
- Logistic Regression
- Support Vector Machine
Tools
Python + Pandas + NLTK/spaCy + Scikit-learn
This project is useful for beginners who want to understand how machine learning can work with text data.
5. Sales Forecasting
Project Type: Time Series / Business Analytics
Sales forecasting is a practical project for anyone interested in business and data analytics.
Project idea
Use historical sales data to identify patterns and estimate future sales.
Your dataset could contain:
- Date
- Product
- Quantity sold
- Revenue
- Location
- Customer type
What can you analyze?
You can identify:
- Monthly sales trends
- Seasonal patterns
- Best-selling products
- High-performing locations
- Revenue changes
Skills you can develop
- Data cleaning
- Time-series analysis
- Trend analysis
- Data visualization
- Forecasting
Tools
Python + Pandas + Matplotlib + Scikit-learn/appropriate forecasting libraries + Power BI
6. Employee Attrition Prediction
Project Type: Classification
Employee attrition is an important business problem because companies want to understand employee turnover.
Project idea
Build a model that predicts whether an employee may leave the organization based on historical employee data.
Possible variables include:
- Job role
- Salary range
- Years of experience
- Working hours
- Job satisfaction
- Department
- Distance from workplace
Skills you can practice
You can learn:
- Classification
- Feature engineering
- Data visualization
- Model evaluation
- Business interpretation
Important point
The goal should not simply be to predict employee behavior. You should also explain the data carefully and avoid making unsupported conclusions about individuals.
7. Healthcare Data Dashboard
Project Type: Data Visualization
You do not need machine learning for every data science project.
A well-designed dashboard can demonstrate your ability to turn raw data into useful information.
Project idea
Use a suitable public healthcare dataset and create an interactive dashboard.
You could analyze:
- Patient numbers
- Hospital departments
- Admission trends
- Age groups
- Treatment categories
- Monthly trends
What can you learn?
- Data cleaning
- Data aggregation
- KPI creation
- Dashboard design
- Data storytelling
- Interactive filtering
Tools
Power BI + Tableau + Python
Remember to use appropriate public or anonymized datasets and avoid exposing personal health information.
8. Weather Data Analysis
Project Type: Exploratory Data Analysis
Weather data is another beginner-friendly project for understanding patterns in large datasets.
Project idea
Analyze historical weather data to understand:
- Temperature trends
- Rainfall
- Humidity
- Wind speed
- Seasonal changes
Questions you can answer
For example:
- Which months have the highest average temperature?
- How does rainfall change throughout the year?
- Are there visible seasonal patterns?
- How are different weather variables related?
Skills
You can practice:
- Pandas
- Data cleaning
- EDA
- Correlation analysis
- Visualization
Tools
Python + Pandas + NumPy + Matplotlib/Seaborn
9. Movie Recommendation System
Project Type: Recommendation System
Recommendation systems are widely used on platforms that provide content or products.
Project idea
Create a basic system that recommends movies based on information such as:
- Genre
- Rating
- Keywords
- Similar movies
- User preferences
What can you learn?
You can understand:
- Similarity calculations
- Feature representation
- Recommendation logic
- Data preprocessing
- Basic machine learning concepts
You can also create a simple interface using Streamlit.
Tools
Python + Pandas + Scikit-learn + Streamlit
10. Interactive Business Intelligence Dashboard
Project Type: Data Analytics + Visualization
For your final portfolio project, consider creating a complete business dashboard.
Project idea
Take a sales, e-commerce, retail, finance, or marketing dataset and build an interactive dashboard.
Your dashboard could show:
- Total sales
- Revenue
- Profit
- Top products
- Regional performance
- Monthly trends
- Customer segments
Tools
Power BI or Tableau
You can also use Python for data preparation.
Why is this useful?
This type of project demonstrates that you can move from:
Raw Data → Analysis → Visualization → Business Insights
That is an important skill for data and business analytics roles.
How to Make Your Data Science Projects Stand Out
Simply uploading a notebook is not enough.
Your project should be easy for another person to understand.
1. Create a Professional GitHub README
Every project should clearly explain:
- What is the problem?
- What dataset did you use?
- What tools did you use?
- What methodology did you follow?
- What were your major findings?
- How well did the model perform?
A recruiter should understand the project without reading every line of your code.
2. Keep Your Code Clean
Avoid uploading confusing notebooks filled with unnecessary code.
Use:
- Clear variable names
- Comments where useful
- Proper headings
- Organized notebooks
- Separate sections for analysis
Explain important decisions instead of simply showing code.
3. Add Visualizations
Charts make your findings easier to understand.
Depending on your project, you can use:
- Bar charts
- Line charts
- Scatter plots
- Heatmaps
- Histograms
- Interactive dashboards
4. Deploy Your Project
If possible, take your project one step further by creating a simple web application.
Tools such as Streamlit can help beginners create interactive applications using Python.
For example, a recruiter could enter house details into your application and see the predicted price.
This makes your portfolio more interactive.
How Many Projects Should a Beginner Build?
You do not need 20 unfinished projects.
Instead, focus on building a smaller number of well-developed projects.
A beginner portfolio could include:
Project 1 — Data Analysis
A practical EDA project using Python and Pandas.
Project 2 — Machine Learning
A classification or regression project.
Project 3 — NLP
A text-based machine learning project.
Project 4 — Business Dashboard
A Power BI or Tableau dashboard.
Project 5 — End-to-End Project
A project that combines data cleaning, machine learning, visualization, and deployment.
The important thing is quality and explanation, not simply the number of projects.
How Login 360 Kochi Can Help Beginners Learn Data Science
Learning data science independently is possible, but beginners can sometimes find it difficult to decide what to learn first.
A structured training program can provide a clear learning path and practical guidance.
Login 360 Kochi, located in Kakkanad, offers data science training covering areas such as:
Core Skills
Students can learn concepts related to:
- Python
- SQL
- Statistics
- Data analysis
- Machine learning
Data Handling
Practical work can include:
- Pandas
- NumPy
- Data cleaning
- Exploratory Data Analysis
Visualization and BI
Students can work with tools such as:
- Power BI
- Tableau
- Data visualization techniques
Machine Learning
The learning path can include concepts such as:
- Regression
- Classification
- Clustering
- Model evaluation
- Machine learning workflows
Practical Projects
Working on practical projects can help students understand how the concepts they learn can be applied to business and industry-related problems.
For course details, curriculum, current batches, and placement-related information, students should verify the latest information directly with Login 360 Kochi before enrolling.
A Simple Data Science Project Roadmap for Beginners
If you are just starting, you do not need to build all ten projects immediately.
You can follow a simple progression:
Step 1: Learn Python basics
↓
Step 2: Learn NumPy and Pandas
↓
Step 3: Practice data cleaning
↓
Step 4: Learn Exploratory Data Analysis
↓
Step 5: Create a visualization project
↓
Step 6: Learn SQL
↓
Step 7: Build a regression project
↓
Step 8: Build a classification project
↓
Step 9: Learn clustering or NLP
↓
Step 10: Build a complete portfolio project
↓
Step 11: Upload your work to GitHub
↓
Step 12: Add your projects to your resume and LinkedIn
This approach allows you to gradually move from basic concepts to complete real-world applications.
Final Thoughts
Learning data science is not just about completing courses or collecting certificates. You need to demonstrate that you can use your knowledge to work with real data and solve practical problems.
The real-world projects every data science beginner should try can cover many areas, including:
- House price prediction
- Customer churn prediction
- Customer segmentation
- NLP projects
- Sales forecasting
- Employee attrition analysis
- Healthcare dashboards
- Weather analysis
- Recommendation systems
- Business intelligence dashboards
Start with one project and complete it properly before moving to the next.
Focus on understanding:
What is the problem?
What data do I need?
How should I clean it?
What patterns can I find?
Which method should I use?
How accurate or useful are my results?
How can I explain my findings to someone without a technical background?
That mindset will help you move beyond simply following tutorials and start thinking like a data professional.
Ready to Start Your Data Science Journey?
If you want structured guidance while learning data science and building practical projects, explore the available courses and training options at Login 360 Kochi.
👉 Contact Login 360 Kochi to learn about the current data science course, curriculum, projects, fees, batches, and career support.