

Table of Contents
Introduction
Excel Projects for Data Analysis are a great way to learn to do practical data analysis. Excel is one of the most popular tools for organising data, doing calculations, finding patterns, and making decisions based on data. Despite the increasing popularity of such tools as SQL, Python, Power BI, and Tableau, knowledge of Excel is still valuable for both newbies and experienced data analysts.
Simply learning Excel formulas is not enough to be a confident data analyst. With Excel projects for data analysis, you will have an opportunity to deal with real data and learn how raw data can be turned into valuable insights. Such projects will also give you practice in data cleaning, calculations, Pivot Tables, charts, and dashboards.
One more thing that is very useful about Excel is that you can analyse data without being an experienced programmer. By working on various Excel projects, you will be able to hone your analytical skills and add projects to your portfolio.
Why Are Excel Projects for Data Analysis Important?
Data analysis is not simply about plugging in numbers in an Excel worksheet. To be a successful data analyst, one should possess some basic knowledge about data collection, data cleansing, data organisation, data analysis, and data presentation.
Excel projects on data analysis give valuable practice in working with real-life datasets that include duplicated records, missing information, inconsistencies, misspellings, and additional useless data. This practice allows developing data analysis and data-cleansing skills.
a standard Excel data analysis project includes several key steps:
- Data collection
- Data cleaning and organisation
- Data analysis
- Creation of PivotTables and charts
- Dashboard creation
- Insight presentation
Excel projects help you understand this process. They also make you feel more confident while dealing with more complex data sets.o make you feel more confident while dealing with more complex data sets.
1. Sales Data Analysis Project
Sales data analysis project is one of the best projects for those who start analyzing data. Sales data is used by most companies, which makes this project very relevant in practice.
A basic data set may consist of:
- Order ID
- Product name
- Product category
- Amount of sales
- Quantity of products sold
- Region
- Client’s name
- Order date
The primary objective of this assignment will be to gain an understanding about the performance of the company and identify any trends.
Excel formulas like SUM, SUMIFS, COUNTIF, and AVERAGE can be used for calculations. Pivot Tables can also be used to summarize large amounts of data in seconds.
2. Customer Analysis Project
Customer data is highly valuable for companies. They analyze customer data to understand purchase behaviors and improve their marketing strategy.
A sample customer database may contain fields like:
- Customer ID
- Customer Name
- Age
- Location
- Product Purchased
- Purchase Amount
- Purchase Date
PivotTable will help in classifying the customers according to age, region or purchasing behaviors. The conditional formatting tool can also be helpful in identifying the high value customers.
Lesson: Data helps organizations understand their target market and make better decisions.
3. Financial Data Analysis Project
Excel is commonly used in financial analysis since calculations, budgeting and report making become easy.
Some of the components in a financial data set may include:
- Date
- Income
- Expenses
- Profit
- Budget
- Expenses Categories
Financial performance of the organization is the central theme.
The Excel charts will assist in visualization of financial trends in a company. The line charts can show changes with regard to time and column charts may compare various categories.
This particular project will enable students to know how data analysis is being applied in businesses in monitoring their financial performance.
4. Employee Performance Analysis
The human resource department deals with a lot of information concerning the employees. Employee performance analysis project can demonstrate how data analytics can be utilized in workforce management.
The dataset might have:
- Employee Id
- Department
- Job Title
- Salary
- Performance Rating
- Attendance
- Experience Years
Some of the functions to be useful in this particular project are Average, Max, Min, CountIf and If.
It is also possible to develop a human resource dashboard displaying the number of employees, performance of departments, attendance, and salary among others.
5. Inventory Management Analysis
Inventory management is crucial for companies dealing with tangible products. They must know the level of inventory so that they do not lack important products or have excessive inventory.
The inventory data set might include:
- Product ID
- Product name
- Category
- Stock Quantity
- Reorder Level
- Supplier
- Unit Price
This project illustrates the ability of data analysis to enhance business efficiency.
6. Marketing Campaign Analysis Project
Marketing campaigns produce lots of information that is valuable to know. The digital marketer measures impressions, clicks, conversions, costs, and revenues to understand the performance of campaigns.
The marketing data set might include:
- Campaign Name
- Marketing channel
- Budget
- Impressions
- Clicks
- Conversions
- Revenue
Excel allows calculating various marketing metrics.
- Click-Through Rate
CTR = Clicks ÷ Impressions × 100
- Conversion Rate
Conversion Rate = Conversions ÷ Clicks × 100
- Return on Investment
ROI = Profit ÷ Investment × 100
One may analyze various channels including Google Ads, Meta Ads, Instagram, email marketing, and SEO.
The benefits of this project are obvious as it helps understand how companies measure their marketing success.
7. Student Performance Analysis
The student performance analysis project is an easy yet helpful project for the beginning learner.
The dataset may include the following columns:
- Student ID
- Student Name
- Subject
- Marks
- Attendance percentage
- Grade
Conditional formatting may be used to highlight students according to their performance. The chart may facilitate subject comparison.
Although the project is easy to complete, it provides an excellent opportunity to practice some Excel features.
8. E-Commerce Sales Dashboard
The e-commerce sales dashboard is one of the best project ideas for a data analytics portfolio.
In an e-commerce dataset there could be:
- Order ID
- Name of Customer
- Product
- Category
- Quantity
- Sales
- Profit
- Region
- Date of Order
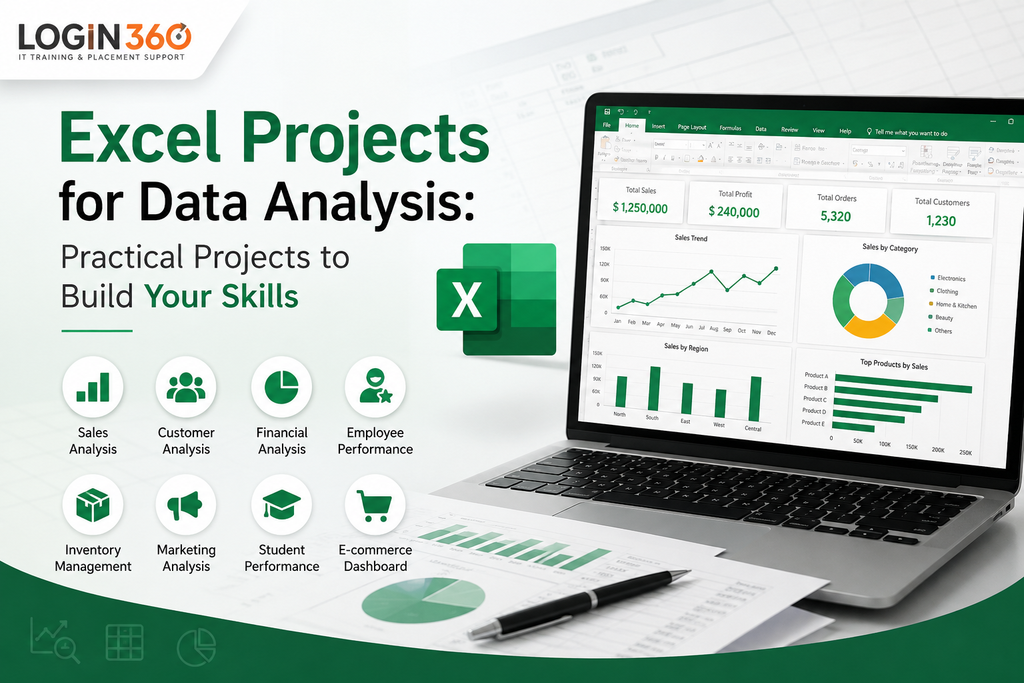
The main idea of your project is to make an interactive dashboard which will give an overall picture of your business performance.
In your project you can use the following Key Performance Indicators:
- Total Sales
- Total Profit
- Total Orders
- Number of Customers
You can also make the charts with monthly sales trend, sales per category, sales per region and top sales products.
Using pivot tables and slicers you can make the dashboard interactive. The user can choose particular year, region or category and see relevant information.
This project shows a lot of analytical skills and can become a nice piece of your portfolio.
Skills You Need for Data Analysis Projects in Excel
During work with Excel projects you should develop several useful skills.
Data Cleaning
Data cleaning is an important part of every data analysis project. There are various tools in Excel, including:
- Remove Duplicates
- Find and Replace
- Text to Columns
- TRIM
- Sorting
- Filtering
Clean data is crucial since wrong information can result in wrong conclusions.
Excel Formulas and Functions
Key formulas used for data analysis are:
- SUM
- AVERAGE
- COUNT
- IF
- SUMIF
- COUNTIF
- SUMIFS
- COUNTIFS
It is also recommended to study lookup functions like XLOOKUP, VLOOKUP, INDEX, and MATCH. Such functions are useful when working with several tables and huge data sets.
PivotTables
PivotTables are some of the most useful Excel features for data analysts. This feature makes it possible to analyze large amounts of data easily.
For instance, with PivotTable you can calculate total sales by regions, revenues by categories, or average employee performance.
Data Visualization
Charts help visualize information and make it easier to understand.
Some useful types of charts are:
- Bar charts
- Column charts
- Line charts
- Pie charts
Building an Excel Portfolio
Project execution is important, but presentation plays an equally crucial role.
For each of the projects, provide a title of the project, project goal, description of the dataset, and details about data cleaning.Completing different data analysis projects in Excel can help you build a strong portfolio and demonstrate your practical analytical skills to employers.
It would be necessary to explain the use of formulas, Pivot Tables, and other approaches in the analysis. Provide screenshots of your dashboard and discuss the key findings from your analysis.
Portfolio will help employers realize your technical knowledge, problem-solving, and analytical
Conclusion
By regularly working on data analysis projects in Excel, beginners can improve their analytical thinking, technical knowledge, and confidence.
Projects related to sales, customers, finances, employees, inventory management, marketing, students’ performance, and e-commerce dashboards can be very helpful.
The best way to do this is by working on small projects and moving towards large and complex projects by practicing regularly. Each project you work on will give you confidence and will prepare you for the future as a data analyst.
Get Started with Data Analytics by Login360
Are you looking for opportunities to learn and apply Excel and data analysis? Login360 provides industry-specific courses for the learners to get hands-on experience with datasets and analytical tools.
Get yourself trained on Excel, SQL, Power BI, and Python and develop the required skillset for a career in data analytics.
Get started on your data analytics career with Login360 and convert your learning into practical skills!