

Table of Contents
Introduction
In today’s data-driven world, businesses rely on information to make smarter decisions. Whether it is a retail company analyzing sales, a hospital tracking patient records, or a marketing team measuring campaign performance, data plays a crucial role in every industry. This growing dependence on data has made Data Analysis Projects in Excel one of the best ways for beginners and professionals to develop practical analytical skills. Microsoft Excel remains one of the most widely used tools for data analysis because it is accessible, easy to learn, and packed with powerful features. From sorting and filtering data to creating PivotTables, dashboards, charts, and forecasting reports, Excel provides everything needed to transform raw data into meaningful insights.
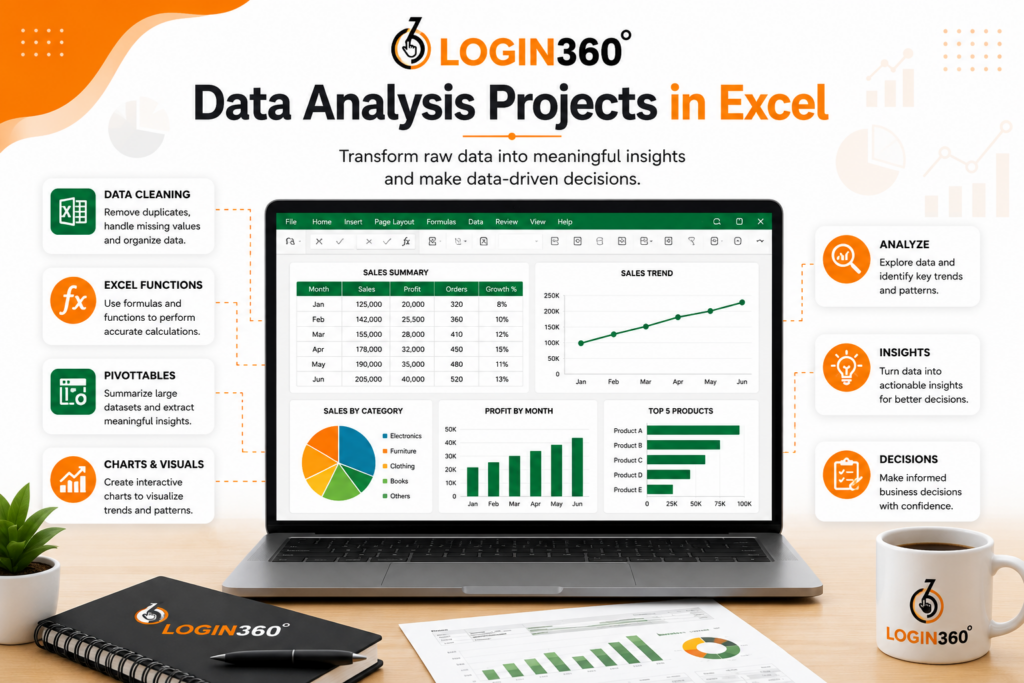
Working on Data Analysis Projects in Excel helps learners move beyond theory by solving real-world business problems. These projects improve analytical thinking, strengthen Excel skills, and prepare individuals for careers in data analytics, finance, marketing, operations, and business intelligence. This guide explores the importance of Excel for data analysis, the essential skills required, and several practical projects that can help you build a strong portfolio.
Why Excel is Still Important for Data Analysis
Although modern analytics tools such as Python, SQL, and Power BI have gained significant popularity, Microsoft Excel continues to be one of the most widely used tools for data analysis across industries. Its simplicity, flexibility, and powerful built-in features make it an ideal choice for both beginners and experienced professionals. Excel provides a user-friendly environment for organizing, cleaning, analyzing, and visualizing data without requiring advanced programming knowledge. It is particularly effective for handling small to medium-sized datasets, making it a practical solution for many business operations. Features like formulas, functions, PivotTables, Pivot Charts, and interactive charts enable users to generate meaningful insights quickly and efficiently. Additionally, Excel integrates seamlessly with other Microsoft Office applications, allowing users to create reports, presentations, and dashboards with ease. Because of its accessibility and widespread adoption, learning Excel remains an essential step for anyone interested in building a successful career in data analytics.
Essential Excel Skills for Data Analysis
Data Cleaning
Raw datasets often contain duplicate records, missing values, formatting inconsistencies, and unnecessary information. Excel provides features such as Remove Duplicates, Text to Columns, Find and Replace, Flash Fill, and Data Validation to prepare clean datasets. Clean data ensures accurate analysis and reliable business decisions.
Excel Formulas and Functions
- SUM: Adds a range of numbers together to calculate the total value.
- AVERAGE: Calculates the average (mean) of selected numerical values.
- COUNT: Counts the number of cells that contain numeric values.
- COUNTIF: Counts the number of cells that meet a specific condition or criterion.
- IF: Performs a logical test and returns one value if the condition is true and another if it is false.
- IFERROR: Returns a custom value instead of an error message when a formula produces an error.
- VLOOKUP: Searches for a value in the first column of a table and returns the corresponding value from another column.
- XLOOKUP: A more advanced lookup function that searches data in any direction and returns matching results with greater flexibility.
- INDEX and MATCH: Works together to perform powerful and flexible lookups by locating and returning data from any row or column.
- TEXT: Converts numbers into text while applying a specified format, such as dates, currency, or percentages.
- LEFT, RIGHT, MID: Extracts specific characters from the beginning, end, or middle of a text string.
- CONCAT: Combines text from multiple cells into a single text string.
- ROUND: Rounds a number to a specified number of decimal places for cleaner calculations and reports.
- PivotTables: Summarize, organize, and analyze large datasets quickly by grouping information and generating meaningful insights with minimal effort.
Benefits of Working on Data Analysis Projects in Excel
- Improves Problem-Solving Skills: Every project presents unique challenges that require logical thinking and analytical decision-making.
- Builds a Professional Portfolio: Employers value candidates who can demonstrate practical experience. Project work showcases your ability to analyze real datasets.
- Enhances Business Understanding: Working with sales, finance, healthcare, HR, and marketing datasets helps you understand how businesses use data.
- Strengthens Excel Expertise: Projects expose learners to various Excel features, making them comfortable with real workplace scenarios.
Best Data Analysis Projects in Excel for Beginners
1. Sales Performance Analysis
Sales Performance Analysis is one of the most practical Data Analysis Projects in Excel because it helps businesses evaluate sales trends, monitor product performance, and make data-driven decisions.
- Analyze Best-Selling Products: Identify the products with the highest sales volume to understand customer demand and optimize inventory planning.
- Evaluate Revenue by Category: Compare different product categories to determine which ones generate the highest revenue and profitability.
- Track Monthly Sales Growth: Analyze month-over-month sales performance to identify growth trends, seasonal patterns, and business performance over time.
- Measure Regional Sales Performance: Compare sales across different regions to identify high-performing markets and areas that require improvement.
- Understand Customer Purchasing Trends: Study customer buying behavior to identify purchasing patterns, popular products, and opportunities for targeted marketing campaigns.
2. Employee Attendance Tracker
- Calculate Total Working Days: Determine the total number of working days in a month by excluding weekends and holidays.
- Track Employee Attendance: Record present days, absent days, and leave days to maintain accurate attendance records.
- Measure Attendance Percentage: Automatically calculate each employee’s attendance percentage using Excel formulas.
- Automate HR Reporting: Use Excel features such as IF statements, COUNTIF, Data Validation, Conditional Formatting, and Date Functions to automate attendance tracking and minimize manual work.
- Generate Monthly Attendance Summaries: Create monthly reports that help HR teams monitor attendance trends, identify irregularities, and support payroll processing and performance evaluation.
3. Student Performance Dashboard
- Analyze Student Scores: Evaluate student marks across different subjects to measure overall academic performance.
- Compare Subject Performance: Display subject averages, highest marks, and lowest marks to identify strengths and areas for improvement.
- Monitor Grade Distribution: Analyze grade distribution and pass percentage to understand overall class performance.
- Build an Interactive Dashboard: Use PivotTables, Charts, Lookup Functions, Dashboard Design, and Conditional Formatting to create a visually appealing and easy-to-understand dashboard.
- Generate Meaningful Academic Reports: Transform raw examination data into actionable insights that help teachers and administrators make informed academic decisions.
4. Monthly Expense Tracker
- Track Monthly Income and Expenses: Record monthly income and categorize expenses to understand spending habits and manage finances effectively.
- Organize Expenses by Category: Classify expenses into categories such as Food, Transportation, Shopping, Rent, Entertainment, Utilities, and Savings for better financial planning.
- Analyze Spending Patterns: Use SUMIFS, Pie Charts, and Line Charts to visualize spending trends and identify areas where expenses can be reduced.
- Compare Budget with Actual Expenses: Perform Budget Comparison to evaluate planned spending against actual expenses and improve financial management.
- Generate Monthly Financial Reports: Create monthly reports that provide insights into financial health, helping individuals and businesses identify unnecessary spending and make better budgeting decisions.
5. Retail Inventory Management
- Monitor product stock levels to identify low inventory, overstocked products, frequently sold items, and supplier performance.
- Use IF Functions, Conditional Formatting, Lookup Functions, Inventory Calculations, and Charts to automate inventory tracking and visualize stock data.
- Analyze inventory trends to determine which products require immediate restocking and which items have excess stock.
- Generate inventory reports that help businesses optimize stock management, reduce storage costs, and improve operational efficiency.
- Enable managers to make informed purchasing decisions while preventing stock shortages, minimizing overstock, and maintaining a balanced inventory.
Why These Beginner Projects Matter
Completing these Data Analysis Projects in Excel helps you understand how data supports everyday business decisions. Instead of only learning formulas, you gain hands-on experience with real datasets, reporting techniques, and visualization methods. These projects also build confidence and prepare you for more advanced analytics tasks involving dashboards, forecasting, and business intelligence tools.
Whether your goal is to become a data analyst, business analyst, or financial analyst, mastering these foundational projects gives you a competitive advantage in the job market.
Best Practices for Data Analysis Projects in Excel
Always begin by cleaning the dataset before performing any calculations. Remove duplicate records, correct formatting issues, and fill or handle missing values appropriately. Use descriptive column names to make datasets easier to interpret. Avoid entering values manually whenever formulas can automate calculations. This reduces errors and saves time. Organize worksheets logically by separating raw data, calculations, and dashboards into different tabs.
Use charts only when they improve understanding. Selecting the right visualization makes reports more effective for stakeholders. Before sharing reports, verify formulas and calculations to ensure accuracy. Applying these practices consistently will improve the quality of your Data Analysis Projects in Excel and make your reports more professional.
Tips to Improve Excel Data Analysis Skills
- Practice with Different Datasets: Work on datasets from various industries to improve your ability to clean, organize, and summarize data effectively using Excel.
- Master Advanced Excel Functions: Learn functions such as XLOOKUP, INDEX, MATCH, SUMIFS, and IFERROR to perform accurate calculations and solve complex data analysis tasks.
- Build Interactive Dashboards: Create dashboards using PivotTables, Pivot Charts, and Slicers to present data visually and make reports more interactive.
- Solve Real-World Business Problems: Practice analyzing sales, finance, healthcare, education, and marketing data instead of relying only on tutorial-based exercises to gain practical experience.
- Explore Advanced Excel Features: As your skills improve, learn Power Query and Power Pivot to handle larger datasets, automate data preparation, and perform more advanced analysis.
Career Opportunities After Learning Excel Data Analysis
- Business Analyst: Analyzes business data to identify trends, improve processes, and help organizations make informed strategic decisions.
- Financial Analyst: Uses Excel to evaluate financial performance, prepare budgets, forecast revenue, and support investment decisions.
- MIS Executive: Creates and manages Management Information System (MIS) reports to track business performance and provide accurate data for decision-making.
- Operations Analyst: Examines operational data to improve efficiency, reduce costs, and optimize day-to-day business processes.
- Reporting Analyst: Develops regular reports and dashboards to present key business metrics and performance insights to stakeholders.
- Market Research Analyst: Analyzes customer behavior, market trends, and competitor data to support marketing and business growth strategies.
- Supply Chain Analyst: Uses Excel to monitor inventory, logistics, procurement, and supply chain performance to improve operational efficiency.
Conclusion
Working on Data Analysis Projects in Excel is one of the most effective ways to build practical analytical skills and gain confidence in handling real-world datasets. From sales reporting and financial analysis to customer segmentation and interactive dashboards, Excel offers a wide range of features that simplify data analysis and support informed decision-making. These projects not only strengthen your understanding of Excel functions, PivotTables, charts, and dashboards but also prepare you for professional roles in data analytics and business intelligence. As you continue practicing with different datasets, you will develop the ability to identify trends, solve business problems, and communicate insights effectively.
If you are planning to begin a career in analytics, investing time in Data Analysis Projects in Excel is an excellent first step. Mastering Excel creates a solid foundation for learning advanced tools and increases your chances of succeeding in today’s data-driven job market.