In today’s world, data has turned out to be one of the most valuable assets for companies all around the globe. But mere data is not enough. Companies require advanced tools that can help them turn complex data sets into useful insights that will help them with their decision making process. And here comes the role of Business Intelligence (BI) tools such as Tableau and Power BI.
If you are thinking of having a career in the field of data analytics, business intelligence or data science, you must have heard about the controversy of Tableau vs Power BI. These tools are dominant in the market of data visualization and analytics and help businesses to build dashboards, reports and other types of visualizations.
But the million dollar question still arises:
Which tool should you learn?
Understanding Tableau and Power BI
Before diving into the comparison, it is important to understand what each tool offers.
What is Tableau?
Tableau is a leading data visualization platform designed to help users analyze and visualize data quickly. It is known for its intuitive drag-and-drop interface, powerful visualization capabilities, and ability to handle large datasets efficiently.
Tableau is widely used by enterprises, analysts, and data professionals who need advanced visual analytics and interactive dashboards.
Key Features of Tableau
- Advanced data visualization capabilities
- Interactive dashboards
- Real-time data analysis
- Strong support for large datasets
- Multiple data source integration
- AI-powered analytics features
- User-friendly drag-and-drop functionality
What is Power BI?
Power BI is Microsoft’s business intelligence and analytics platform that enables users to create reports, dashboards, and visualizations from multiple data sources.
Power BI has gained immense popularity because of its affordability, seamless integration with Microsoft products, and strong analytical capabilities.
Key Features of Power BI
- Interactive dashboards and reports
- Integration with Microsoft ecosystem
- AI-powered insights
- Data modeling capabilities
- Real-time reporting
- Cloud and on-premises deployment options
- Affordable licensing structure
Tableau vs Power BI: Key Differences
Let’s compare both platforms across important factors.
| Feature | Tableau | Power BI |
| Ease of Use | Beginner-friendly for visualization | Beginner-friendly with Microsoft familiarity |
| Visualization Quality | Highly advanced and customizable | Strong but slightly less flexible |
| Data Handling | Excellent for large datasets | Good but depends on infrastructure |
| Pricing | Higher cost | More affordable |
| Microsoft Integration | Limited | Excellent |
| Learning Curve | Moderate | Easier for Excel users |
| Deployment | Cloud and on-premises | Cloud and on-premises |
| Community Support | Strong | Very large and growing |
| Performance | Excellent visualization performance | Excellent reporting performance |
Ease of Learning: Tableau vs Power BI
One of the most important considerations for beginners is how easy the tool is to learn.
Learning Tableau
Tableau is designed around visual exploration. Users can create charts, graphs, and dashboards through simple drag-and-drop actions. The interface is intuitive, making it easier for beginners to start building visualizations quickly.
However, mastering advanced Tableau features such as calculated fields, level-of-detail expressions, and advanced analytics requires practice.
Tableau Learning Advantages
- Visual-first approach
- Intuitive dashboard creation
- Extensive online tutorials
- Strong data storytelling capabilities
Learning Power BI
Power BI is particularly easy for users who already work with Microsoft Excel. Many concepts, formulas, and workflows feel familiar, reducing the learning curve significantly.
Power BI also uses DAX (Data Analysis Expressions) for advanced calculations. While basic reporting is easy, mastering DAX can take time.
Power BI Learning Advantages
- Familiar interface for Excel users
- Simple report-building process
- Excellent Microsoft integration
- Strong documentation and learning resources
Winner: Ease of Learning
For most beginners, Power BI is slightly easier to learn, especially if they already have experience with Excel.
Data Visualization Capabilities
Visualization is where the debate around Tableau vs Power BI becomes particularly interesting.
Tableau Visualization Strengths
Tableau is often considered the industry leader in data visualization. It provides:
- Highly interactive dashboards
- Advanced visual customization
- Rich storytelling features
- Complex chart options
- Superior graphical presentation
Data analysts often prefer Tableau when visual storytelling is a top priority.
Power BI Visualization Strengths
Power BI offers:
- Interactive visualizations
- Custom visual marketplace
- Dashboard sharing capabilities
- AI-driven visual insights
While Power BI visualizations are powerful, Tableau generally offers more flexibility and sophistication.
Winner: Visualization
Tableau takes the lead when it comes to advanced data visualization and storytelling.
Data Connectivity and Integration
Modern organizations use data from multiple sources, making connectivity an essential factor.
Tableau Connectivity
Tableau connects with:
- SQL databases
- Cloud platforms
- Excel files
- Google Analytics
- Salesforce
- Big data platforms
Its extensive connectivity options make it suitable for complex enterprise environments.
Power BI Connectivity
Power BI supports:
- Excel
- SQL Server
- Azure
- SharePoint
- Dynamics 365
- Google Analytics
- Cloud databases
Power BI shines when organizations already use Microsoft technologies.
Winner: Integration
For Microsoft-based environments, Power BI is the clear winner.
Performance with Large Data Sets
Organizations often deal with millions of records.
Tableau Performance
Tableau is known for efficiently handling large volumes of data. Its architecture allows users to analyze large datasets while maintaining visualization performance.
Power BI Performance
Power BI also handles large datasets effectively, especially when optimized correctly. However, performance may vary depending on data models and system configurations.
Winner: Large Data Handling
Tableau generally performs better for extremely large and complex datasets.
Pricing Comparison
Cost is often a deciding factor when choosing between Tableau and Power BI.
Tableau Pricing
Tableau offers several licensing options, but enterprise-level implementations can become expensive.
It is often preferred by large organizations with dedicated analytics budgets.
Power BI Pricing
Power BI is significantly more affordable and offers excellent value for individuals, startups, and small businesses.
The lower entry cost has contributed to its rapid adoption worldwide.
Winner: Pricing
Power BI offers better affordability and return on investment for most learners and organizations.
Career Opportunities: Tableau vs Power BI
Both tools are highly demanded in the job market.
Careers That Use Tableau
Professionals working with Tableau often hold positions such as:
- Data Analyst
- Business Intelligence Analyst
- Data Visualization Specialist
- Analytics Consultant
- Business Analyst
Industries including finance, healthcare, retail, and technology frequently use Tableau.
Careers That Use Power BI
Power BI is commonly used in roles such as:
- BI Developer
- Power BI Developer
- Data Analyst
- Reporting Analyst
- Business Intelligence Consultant
Organizations using Microsoft ecosystems frequently seek Power BI professionals.
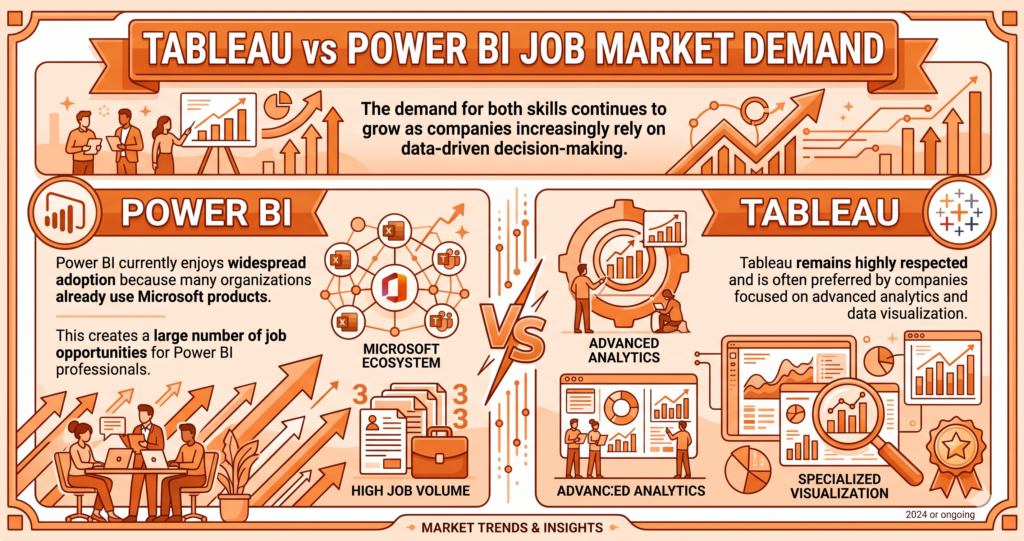
Tableau vs Power BI Job Market Demand
The demand for both skills continues to grow as companies increasingly rely on data-driven decision-making.
Power BI currently enjoys widespread adoption because many organizations already use Microsoft products. This creates a large number of job opportunities for Power BI professionals.
Tableau remains highly respected and is often preferred by companies focused on advanced analytics and data visualization.
Winner: Job Opportunities
Power BI generally offers more job opportunities due to its extensive adoption across industries.
Tableau vs Power BI for Data Analysts
For aspiring data analysts, both tools offer valuable skills.
Choose Tableau If You Want To:
- Focus heavily on visualization
- Create advanced dashboards
- Work in analytics-focused organizations
- Develop strong data storytelling skills
Choose Power BI If You Want To:
- Work within Microsoft environments
- Learn reporting and dashboarding quickly
- Access more entry-level opportunities
- Gain a highly marketable skill
Tableau vs Power BI for Businesses
Organizations choose tools based on their requirements.
Tableau is Best For:
- Large enterprises
- Advanced visual analytics
- Complex data exploration
- High-end dashboard design
Power BI is Best For:
- Small and medium businesses
- Microsoft-based organizations
- Cost-conscious companies
- Rapid reporting implementation
Can You Learn Both?
Absolutely.
In fact, many data professionals eventually learn both Tableau and Power BI.
The underlying concepts remain similar:
- Data cleaning
- Data modeling
- Dashboard creation
- KPI reporting
- Data storytelling
- Business intelligence principles
Once you understand one tool, transitioning to the other becomes significantly easier.
For learners who want maximum career flexibility, learning both tools can be a strong long-term strategy.
Which One Should Beginners Learn First?
For most beginners entering the analytics field, Power BI is often the recommended starting point because:
- It is more affordable.
- It integrates well with Excel.
- It has a lower learning curve.
- It is widely used by businesses.
- It offers strong job market demand.
After building a foundation in Power BI, learners can expand their expertise by learning Tableau for advanced visualization and analytics.
Final Verdict: Tableau vs Power BI
The debate around Tableau vs Power BI does not have a one-size-fits-all answer. Both platforms are powerful, widely used, and valuable for career growth.
If your goal is to master advanced visualization, create stunning dashboards, and work with large-scale enterprise analytics, Tableau is an excellent choice.
If you want a cost-effective, beginner-friendly tool with strong job market demand and seamless Microsoft integration, Power BI is the better option.
Quick Recommendation
- Choose Tableau for advanced visual analytics and data storytelling.
- Choose Power BI for affordability, ease of learning, and broader business adoption.
- Learn both if you want the widest range of career opportunities in data analytics and business intelligence.
As data continues to drive business decisions across industries, mastering either Tableau or Power BI can open doors to rewarding careers in analytics, reporting, and business intelligence. The best choice is the one that aligns with your career goals, learning preferences, and the type of organizations you want to work with.