
Table of Contents
Introduction
Data analytics has become one of the most valuable skills in today’s digital world. Organizations collect huge amounts of data every day, and they rely on analytics professionals to transform this data into meaningful insights. Whether it is improving customer satisfaction, increasing sales, reducing costs, or predicting future trends, data analytics plays a vital role in decision making. For beginners, learning the right tools is the first step toward building a successful career in this field. Modern data analytics tools simplify data collection, cleaning, visualization, and reporting, allowing users to uncover patterns without needing advanced programming knowledge. By understanding these tools, beginners can develop practical skills that are highly demanded across industries such as healthcare, finance, retail, education, and technology.
Why Learn Best Data Analytics Tools?
Learning data analytics tools provides numerous career and business opportunities. Companies prefer professionals who can analyze data efficiently and present actionable insights using industry standard software. These tools help users organize data, automate repetitive tasks, create interactive dashboards, and perform advanced statistical analysis. They also improve problem solving abilities by enabling users to identify trends, forecast outcomes, and make data driven decisions. As businesses continue to adopt digital transformation strategies, the demand for data analysts is increasing rapidly. Beginners who master popular analytics tools gain a competitive advantage in the job market and build a strong foundation for advanced careers in data science, artificial intelligence, and business intelligence.
How to Choose the Right Best Data Analytics Tool as a Beginner
Selecting the right data analytics tool depends on your learning goals, technical background, and career aspirations. Beginners should start with tools that have easy to use interfaces, extensive learning resources, and strong community support. It is also important to consider industry demand, compatibility with other software, and opportunities for future growth. Learning spreadsheet software like Excel builds analytical thinking, while SQL helps retrieve data from databases. Visualization tools such as Tableau and Power BI make it easier to communicate insights, whereas programming languages like Python and R support advanced analysis and automation. Choosing tools that complement each other creates a balanced skill set that prepares beginners for real world analytics projects.
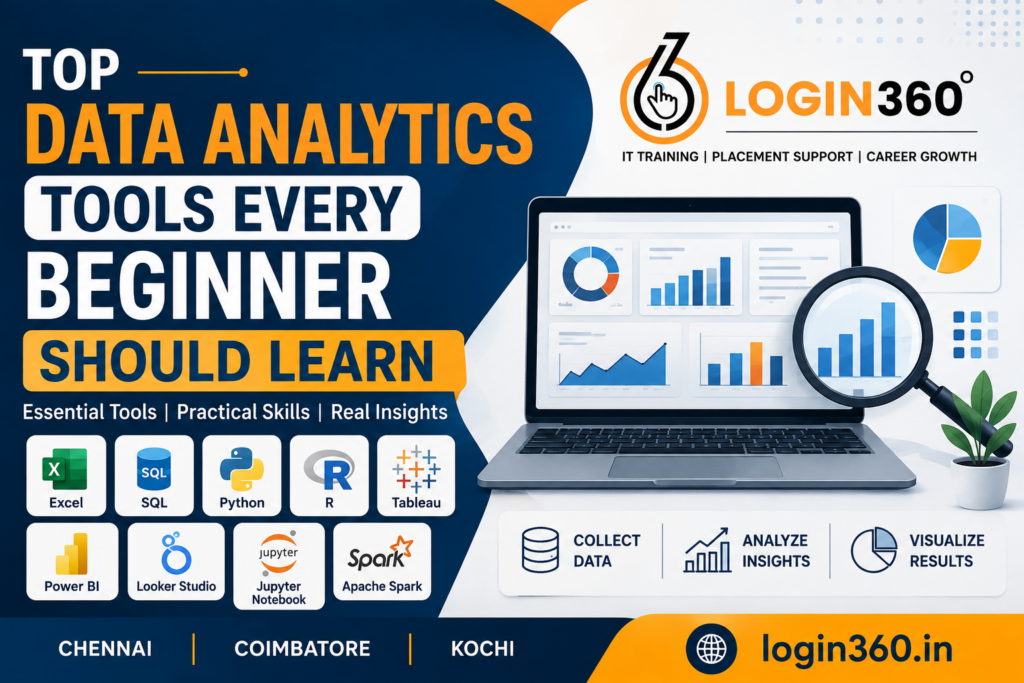
Best Data Analytics Tools Every Beginner Should Learn
- Microsoft Excel – A powerful spreadsheet tool used for organizing, analyzing, and visualizing data with formulas, charts, and pivot tables.
- SQL – A database language that allows users to retrieve, filter, update, and manage structured data efficiently.
- Python – A beginner friendly programming language widely used for data analysis, automation, machine learning, and visualization.
- R Programming – A statistical programming language designed for data analysis, research, and creating advanced visualizations.
- Tableau – A leading business intelligence tool that creates interactive dashboards and attractive data visualizations.
- Microsoft Power BI – A business analytics platform used to build reports, dashboards, and real time business insights.
- Google Looker Studio – A free cloud based reporting tool that transforms data into customizable interactive dashboards.
- Jupyter Notebook – An interactive environment where users can write code, analyze data, and document projects in one place.
- Apache Spark – A big data processing framework capable of handling massive datasets with high speed and scalability.
Comparison Table of Popular Data Analytics Tools
Choosing the right data analytics tool depends on your career goals, the type of data you work with, and the skills required for your target role. The table below compares the most popular tools covered in this guide.
| Tool | Best For | Difficulty Level | Free Version | Programming Required |
|---|---|---|---|---|
| Microsoft Excel | Data organization, calculations, reporting | Beginner | No | No |
| SQL | Database querying and management | Beginner | Yes | Basic SQL syntax |
| Python | Data analysis, automation, machine learning | Intermediate | Yes | Yes |
| R | Statistical analysis and research | Intermediate | Yes | Yes |
| Tableau | Interactive dashboards and visualization | Beginner | Yes (Public Edition) | No |
| Microsoft Power BI | Business intelligence and reporting | Beginner | Yes | No (Basic DAX is useful) |
| Google Looker Studio | Marketing dashboards and reporting | Beginner | Yes | No |
| Jupyter Notebook | Coding, experimentation, and documentation | Beginner | Yes | Yes |
| Apache Spark | Big data processing | Advanced | Yes | Yes |
Essential Skills to Learn Alongside These Tools
Mastering data analytics requires more than learning software alone. Beginners should develop a strong understanding of statistics, data cleaning, critical thinking, and problem solving. Knowledge of databases, spreadsheet functions, and data visualization principles significantly improves analytical performance. Learning programming concepts, especially in Python or R, helps automate repetitive tasks and perform advanced analysis. Communication skills are equally important because analysts must explain findings clearly to non technical stakeholders. Understanding business processes, creating meaningful reports, and presenting actionable recommendations make analytics professionals more valuable in any organization. Combining technical expertise with business knowledge enables beginners to solve real world problems effectively.
Recommended Learning Path for Beginners
Step 1: Learn Microsoft Excel
Begin by understanding formulas, PivotTables, charts, sorting, filtering, and data cleaning. Excel provides a solid introduction to working with datasets.
Step 2: Learn SQL
Next, learn how to retrieve and filter data from relational databases. Practice writing queries using commands such as SELECT, WHERE, GROUP BY, and JOIN.
Step 3: Learn Data Visualization
After becoming comfortable with Excel and SQL, move on to Power BI or Tableau. These tools help transform raw data into interactive dashboards and reports.
Step 4: Learn Python
Once you understand the basics of analytics, start learning Python. Focus on libraries such as Pandas, NumPy, Matplotlib, and Plotly to automate tasks and analyze larger datasets.
Step 5: Build Real Projects
- Sales performance dashboard
- Customer segmentation analysis
- Website traffic report
- Financial expense tracker
- Employee performance dashboard
- Retail sales analysis
Step 6: Learn Advanced Topics
- Machine Learning
- Predictive Analytics
- Big Data
- Cloud Analytics
- Apache Spark
- Artificial Intelligence
Free Resources to Practice Data Analytics
Many high quality free resources are available for beginners to develop practical analytics skills. Online learning platforms offer introductory courses covering Excel, SQL, Python, Tableau, and Power BI. Public datasets from government organizations, healthcare institutions, and open data communities provide excellent opportunities for hands on practice. Coding platforms allow users to solve SQL and Python challenges, while GitHub hosts numerous analytics projects that demonstrate industry best practices. Video tutorials, blogs, webinars, and discussion forums also help learners understand complex concepts through real world examples. Consistent practice using free resources enables beginners to build a strong portfolio without spending significant money.
Common Mistakes Beginners Should Avoid
Learning Too Many Tools at Once
Focus on mastering one tool before moving to the next. A strong understanding of the fundamentals is more valuable than superficial knowledge of many tools.
Ignoring SQL
Some beginners jump directly into Python or visualization software while overlooking SQL. Since most organizations store data in databases, SQL is an essential skill that should not be skipped.
Memorizing Instead of Practicing
Watching tutorials alone is not enough. Apply what you learn by solving real problems, completing exercises, and building projects.
Neglecting Data Cleaning
Many beginners rush into creating charts without preparing the data. Cleaning and validating data is a crucial step that directly impacts the accuracy of your analysis.
Focusing Only on Technical Skills
Employers also value communication, teamwork, and business understanding. Developing these skills alongside technical expertise will make you a more effective analyst.
Giving Up Too Early
Programming, SQL queries, and statistical concepts can be challenging at first. Consistent practice and patience are key to long term success.
Career Opportunities After Learning Data Analytics Tools
Learning data analytics tools opens doors to numerous career opportunities across various industries. Beginners can pursue roles such as Data Analyst, Business Analyst, Reporting Analyst, Financial Analyst, Marketing Analyst, Operations Analyst, and Business Intelligence Developer. As experience grows, professionals can advance to positions like Data Scientist, Analytics Consultant, Data Engineer, or Machine Learning Engineer. Organizations of all sizes increasingly depend on data driven strategies, making analytics skills valuable in sectors including healthcare, banking, retail, manufacturing, education, logistics, and information technology. Building a portfolio of projects, earning certifications, and continuously upgrading technical skills significantly improves employment prospects and career growth.
Conclusion
Data analytics is a rewarding field that combines technology, business knowledge, and critical thinking to solve real world problems. Beginners should focus on learning industry standard tools such as Excel, SQL, Python, Tableau, Power BI, Google Looker Studio, Jupyter Notebook, and Apache Spark in a logical sequence. Each tool contributes unique capabilities, from data management and visualization to programming and big data processing. Alongside technical knowledge, developing communication, analytical thinking, and practical project experience is essential for long term success. By following a structured learning path and practicing consistently, beginners can build a strong foundation for a successful career in data analytics and confidently meet the growing demand for skilled data professionals.