Introduction
Information surrounds us all around. All clicks, sales, and contacts leave a lot of valuable information that could help businesses in making better decisions. However, bare data will not say anything to you until you have appropriate Data Analytics Tools . If you are about to dive into the field of data analysis or improve your already existing skills, having the knowledge about the most commonly used data analysis tools (as well as the reasons for their popularity) will certainly benefit you. The following guide describes some of the most popular data analysis tools and the people who should use them.
Why Do You Need Data Analytics Tools?
But before moving on to the list itself, let’s explain why we need these tools?
Modern companies face the problem of handling large amounts of data – be it sales numbers, website traffic, social media stats, or data about supply chains. Without tools, it’s simply not possible to make sense out of all that information. With appropriate analytics tools you will be able to:
- Gather and structure data from various sources.
- Eliminate inconsistencies and mistakes.
- Analyze data statistically without having to write complicated codes yourself.
- Create visual dashboards which can be understood even by people who don’t have a technical background.
- Make predictions based on historic data.
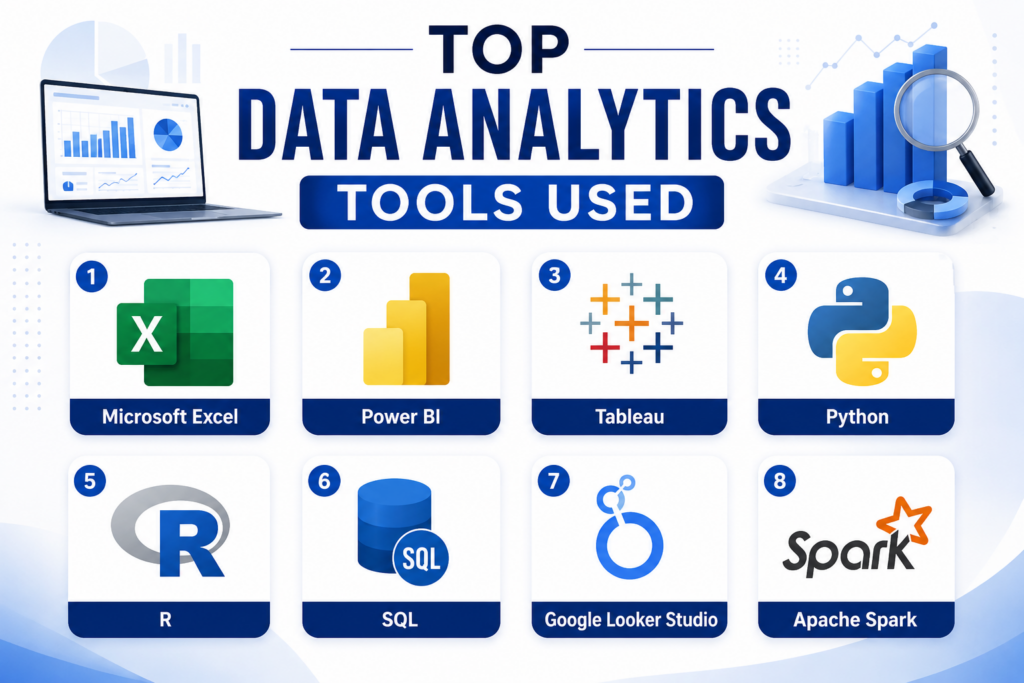
1. Microsoft Excel
We begin with the one which is the oldest one and which has not been overtaken by any new tool yet. Excel happens to be one of the most popularly used tools for data analytics in different business organizations. Although simple and easy to use, it has some very powerful features that can make it extremely useful for your analysis needs. The pivot tables, power query, and statistical functions make it quite a capable analytical tool.
2. Power BI
One of the most popular data analytics software for business intelligence and reporting is Microsoft Power BI. It is an integrated service that allows users to connect to various data sources from Excel, SQL databases, cloud, and APIs, and generate interactive reports that can refresh in real time.The main thing that distinguishes Microsoft Power BI from other tools is that it is user-friendly. One does not have to have any coding experience to be able to create meaningful reports using Power BI.
3. Tableau
While Power BI is a workhorse for businesses, Tableau is an analyst’s darling when it comes to visual representation of data. The program is specially designed for visualization and exploration of data, and the quality of its visuals is unmatched.Tableau works with almost any type of data source – from CSV files and Excel sheets to cloud databases and Big Data tools. With its intuitive drag-and-drop interface, you can create complex charts and dashboards in no time
4. Python
Python has emerged as the bedrock upon which modern Data Analytics and data science operate. It is not one single tool but an entire programming language with a comprehensive set of libraries that have been developed for the purpose of handling data.Pandas are used to manipulate data, Numpy to perform numerical computation, Matplotlib and Seaborn to generate visuals, and Scikit-Learn for Machine Learning operations.
5. R
The programming language that has been created specifically for statistical analysis and data visualization purposes is R. This tool is popular among researchers, health care analysts, and wherever there is an application of rigorous statistical procedures. While Python is a general-purpose programming language made into a data tool, R has been designed for doing statistics from scratch. The visuals generated by its ggplot2 library are among the most sophisticated data visuals.
6. SQL
SQL or Structured Query Language is the basis of database management. Every organization keeps its data in a relational database and uses SQL to analyze and extract information from that database.As opposed to Python or R, SQL is not a programming language; it serves a single purpose – to communicate with databases. However, this single feature is crucial to doing data analytics.
7. Google Looker Studio (previously known as Data Studio)
For companies operating in the Google environment, Google Analytics, Google Ads, Google Sheets, Looker Studio is a perfect match. This is a free platform enabling users to extract data from Google products and build informative dashboards.Although it is not as flexible as Power BI or Tableau in complex analytical tasks, for marketing teams it is quite enough.
8. Apache Spark
When you’re working with really huge databases, literally millions of rows and live data feeds, Excel and even Python on one computer aren’t enough. That’s when you would use Apache Spark.Apache Spark is an open-source cluster computing framework meant for Big Data processing. This tool is used by data engineers and large corporate analytics departments to process data across
Conclusion
The field of analytics changes all the time but one thing stays true proper data preparation, analysis and decision making. Whatever path you choose from Excel through Python, the most important skill to develop is the one of asking the right questions and being ready to listen to the answers your data gives you. If you want to learn some of these skills for your work or career, then structured training will save you loads of time. With Login360 you can get practical training in Data Analytics with Python, Power BI, Excel and many other courses!